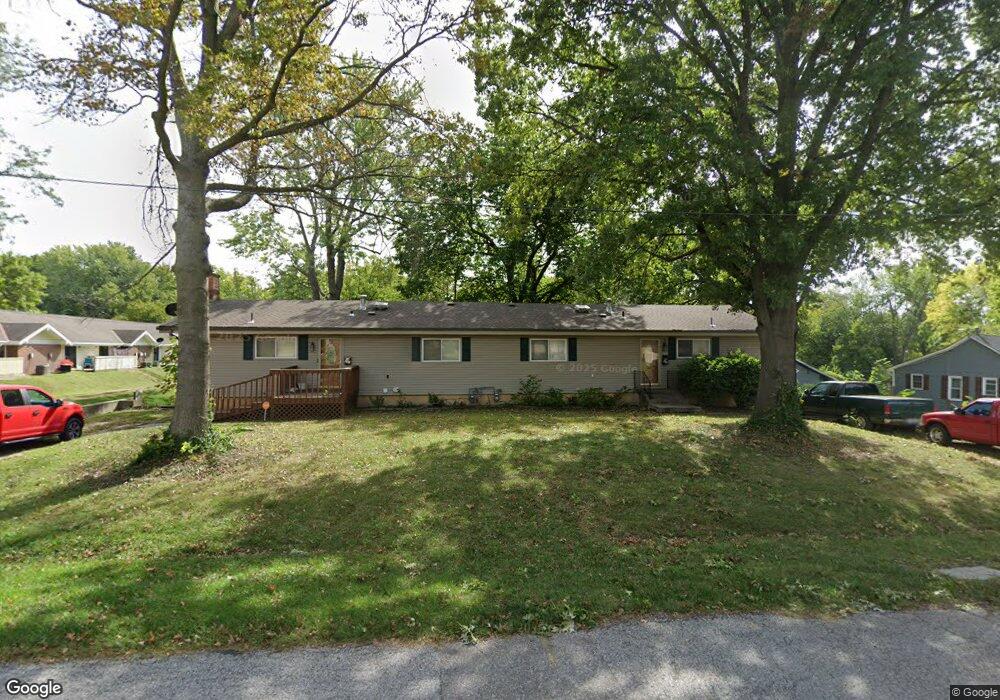
201 Spring St Belton, MO 64012
Estimated Value: $269,000 - $332,000
4
Beds
2
Baths
1,920
Sq Ft
$154/Sq Ft
Est. Value
About This Home
This home is located at 201 Spring St, Belton, MO 64012 and is currently estimated at $295,842, approximately $154 per square foot. 201 Spring St is a home located in Cass County with nearby schools including Scott Elementary School, Mill Creek Upper Elementary School, and Belton Middle School.
Ownership History
Date
Name
Owned For
Owner Type
Purchase Details
Closed on
Jul 28, 2017
Sold by
Hawkins Ronald D and Hawkins Karen S
Bought by
Wiley Clinton
Current Estimated Value
Home Financials for this Owner
Home Financials are based on the most recent Mortgage that was taken out on this home.
Original Mortgage
$144,508
Outstanding Balance
$119,837
Interest Rate
3.91%
Mortgage Type
FHA
Estimated Equity
$176,005
Create a Home Valuation Report for This Property
The Home Valuation Report is an in-depth analysis detailing your home's value as well as a comparison with similar homes in the area
Home Values in the Area
Average Home Value in this Area
Purchase History
| Date | Buyer | Sale Price | Title Company |
|---|---|---|---|
| Wiley Clinton | -- | Continental Title |
Source: Public Records
Mortgage History
| Date | Status | Borrower | Loan Amount |
|---|---|---|---|
| Open | Wiley Clinton | $144,508 |
Source: Public Records
Tax History
| Year | Tax Paid | Tax Assessment Tax Assessment Total Assessment is a certain percentage of the fair market value that is determined by local assessors to be the total taxable value of land and additions on the property. | Land | Improvement |
|---|---|---|---|---|
| 2025 | $2,714 | $37,380 | $4,220 | $33,160 |
| 2024 | $2,714 | $32,920 | $3,830 | $29,090 |
| 2023 | $2,707 | $32,920 | $3,830 | $29,090 |
| 2022 | $2,374 | $28,610 | $3,830 | $24,780 |
| 2021 | $2,374 | $28,610 | $3,830 | $24,780 |
| 2020 | $2,313 | $27,710 | $3,830 | $23,880 |
| 2019 | $2,265 | $27,710 | $3,830 | $23,880 |
| 2018 | $1,982 | $24,450 | $3,070 | $21,380 |
| 2017 | $1,864 | $24,450 | $3,070 | $21,380 |
| 2016 | $1,864 | $22,870 | $3,070 | $19,800 |
| 2015 | $1,864 | $22,870 | $3,070 | $19,800 |
| 2014 | $1,870 | $22,870 | $3,070 | $19,800 |
| 2013 | -- | $22,870 | $3,070 | $19,800 |
Source: Public Records
Map
Nearby Homes
- 202 Spring St
- 205 Spring St
- 122 Spring St
- 206 Spring St
- 207 Spring St
- 209 Spring St
- 208 Spring St
- 118 Spring St
- 211 Spring St
- 211 Spring St Unit House
- 211 Spring St Unit 4
- 210 Spring St
- 111 Spring St
- 201 Lynn St
- 116 Spring Ct
- 207 Lynn St
- 213 Spring St
- 112 Spring Ct Unit 114
- 203 Baldwin St
- 117 Baldwin St
Your Personal Tour Guide
Ask me questions while you tour the home.