201 Starry Rd Sequim, WA 98382
Estimated Value: $561,152 - $672,000
3
Beds
2
Baths
1,582
Sq Ft
$385/Sq Ft
Est. Value
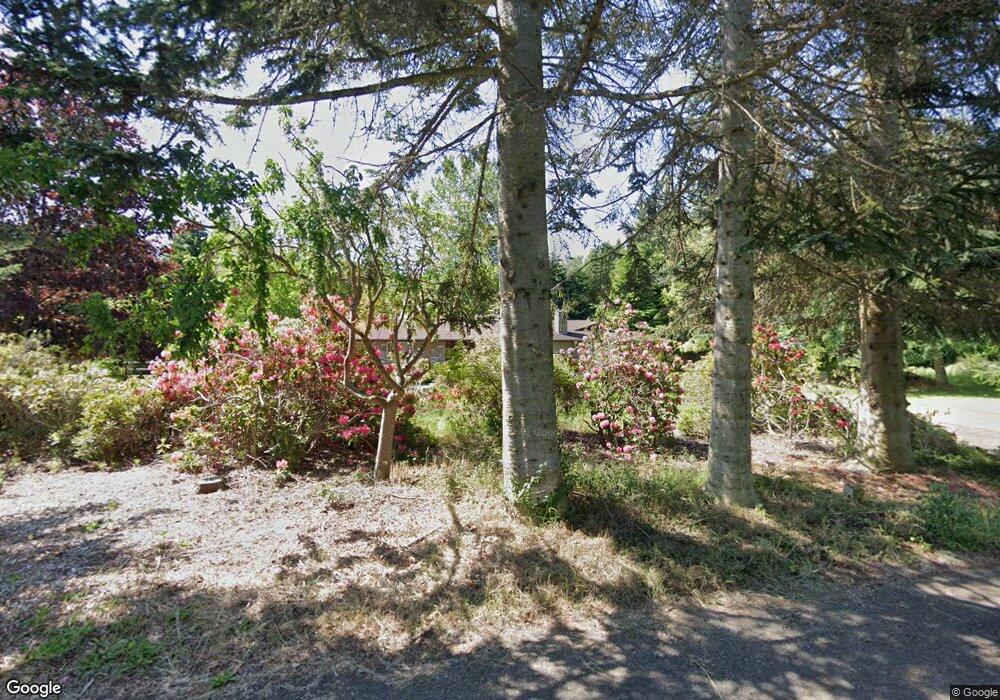
About This Home
This home is located at 201 Starry Rd, Sequim, WA 98382 and is currently estimated at $609,051, approximately $384 per square foot. 201 Starry Rd is a home located in Clallam County with nearby schools including Greywolf Elementary School, Sequim Middle School, and Sequim Senior High School.
Ownership History
Date
Name
Owned For
Owner Type
Purchase Details
Closed on
Jul 6, 2020
Sold by
Lange Raymond E and Ilsem Lange Trust
Bought by
Lange Raymond E
Current Estimated Value
Purchase Details
Closed on
Aug 6, 2013
Sold by
Lange Raymond E
Bought by
Lange Ilse M
Purchase Details
Closed on
Oct 26, 2007
Sold by
Austin Christopher H and Austin Michelle E
Bought by
Lang Ann
Purchase Details
Closed on
Dec 7, 2005
Sold by
Britton Leonard C and Britton Sally S
Bought by
Austin Christopher H and Austin Michelle E
Home Financials for this Owner
Home Financials are based on the most recent Mortgage that was taken out on this home.
Original Mortgage
$66,800
Interest Rate
6.31%
Mortgage Type
Stand Alone Second
Create a Home Valuation Report for This Property
The Home Valuation Report is an in-depth analysis detailing your home's value as well as a comparison with similar homes in the area
Purchase History
We collect this data history from publicly available records. To have your information removed, we recommend requesting removal directly through your county’s website.
| Date | Buyer | Sale Price | Title Company |
|---|---|---|---|
| Lange Raymond E | -- | None Available | |
| Lange Ilse M | -- | None Available | |
| Lang Ann | $333,000 | Olympic Peninsula Title Co | |
| Austin Christopher H | $334,000 | Olympic Peninsula Title Co |
Source: Public Records
Mortgage History
We collect this data history from publicly available records. To have your information removed, we recommend requesting removal directly through your county’s website.
| Date | Status | Borrower | Loan Amount |
|---|---|---|---|
| Previous Owner | Austin Christopher H | $66,800 |
Source: Public Records
Tax History
| Year | Tax Paid | Tax Assessment Tax Assessment Total Assessment is a certain percentage of the fair market value that is determined by local assessors to be the total taxable value of land and additions on the property. | Land | Improvement |
|---|---|---|---|---|
| 2025 | $3,814 | $494,440 | $179,975 | $314,465 |
| 2023 | $3,814 | $514,239 | $179,975 | $334,264 |
| 2022 | $3,215 | $490,764 | $156,500 | $334,264 |
| 2021 | $2,955 | $320,149 | $103,230 | $216,919 |
| 2020 | $3,102 | $320,149 | $103,230 | $216,919 |
| 2018 | $2,793 | $280,024 | $103,230 | $176,794 |
| 2017 | $2,490 | $260,069 | $103,230 | $156,839 |
| 2016 | $2,539 | $265,335 | $103,230 | $162,105 |
| 2015 | $2,568 | $263,812 | $91,125 | $172,687 |
| 2013 | $2,568 | $248,113 | $91,125 | $156,988 |
| 2012 | $2,568 | $258,238 | $101,250 | $156,988 |
Source: Public Records
Map
Nearby Homes
- 520 Grandview Dr
- 272 Grandview Dr
- 7171 Old Olympic Hwy
- 21 Donaper Rd
- 141 Pheasant Run Dr
- 101 Timothy Ln
- 431 Fasola Rd
- 221 Mccomb Ln
- 20 van Dyken Dr
- 17 van Dyken Dr
- 19 van Dyken Dr
- 3220 Woodcock Rd
- 9999
- 9999 van Dyken Dr Lot19
- TBA van Dyken Dr
- 9999 Lange Ln Lot 13
- TBA Lange Ln
- 12 Lange Ln
- 16 Lange Ln
- 72 Lange Ln
Your Personal Tour Guide
Ask me questions while you tour the home.