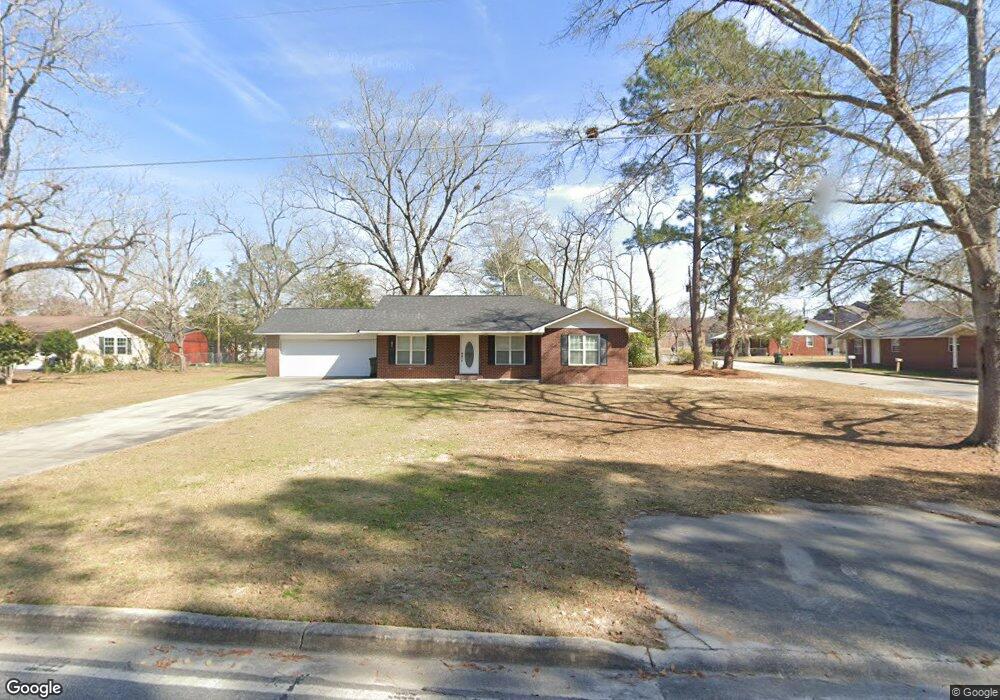
201 Stewart St Claxton, GA 30417
Estimated Value: $149,000 - $202,000
3
Beds
3
Baths
1,517
Sq Ft
$120/Sq Ft
Est. Value
About This Home
This home is located at 201 Stewart St, Claxton, GA 30417 and is currently estimated at $182,053, approximately $120 per square foot. 201 Stewart St is a home located in Evans County with nearby schools including Claxton Elementary School, Second Chance, and Claxton Middle School.
Ownership History
Date
Name
Owned For
Owner Type
Purchase Details
Closed on
May 27, 2021
Sold by
Malmberg Lawatha
Bought by
Seago Cynthia M
Current Estimated Value
Home Financials for this Owner
Home Financials are based on the most recent Mortgage that was taken out on this home.
Original Mortgage
$102,681
Outstanding Balance
$92,965
Interest Rate
2.9%
Mortgage Type
New Conventional
Estimated Equity
$89,088
Purchase Details
Closed on
Aug 14, 2006
Sold by
Deloach Theron
Bought by
Malmberg Lawatha
Home Financials for this Owner
Home Financials are based on the most recent Mortgage that was taken out on this home.
Original Mortgage
$105,600
Interest Rate
6.67%
Purchase Details
Closed on
May 9, 2002
Sold by
Landmark Investments
Bought by
Deloach Theron
Purchase Details
Closed on
Aug 27, 1998
Sold by
Sallee Reba Elizabet
Bought by
Landmark Investments
Purchase Details
Closed on
May 6, 1996
Sold by
Sallee Cleo Leon
Bought by
Sallee Reba Elizabet
Create a Home Valuation Report for This Property
The Home Valuation Report is an in-depth analysis detailing your home's value as well as a comparison with similar homes in the area
Home Values in the Area
Average Home Value in this Area
Purchase History
| Date | Buyer | Sale Price | Title Company |
|---|---|---|---|
| Seago Cynthia M | $135,000 | -- | |
| Malmberg Lawatha | $132,000 | -- | |
| Deloach Theron | $4,500 | -- | |
| Landmark Investments | $4,500 | -- | |
| Sallee Reba Elizabet | -- | -- |
Source: Public Records
Mortgage History
| Date | Status | Borrower | Loan Amount |
|---|---|---|---|
| Open | Seago Cynthia M | $102,681 | |
| Previous Owner | Malmberg Lawatha | $105,600 | |
| Previous Owner | Malmberg Lawatha | $26,400 |
Source: Public Records
Tax History Compared to Growth
Tax History
| Year | Tax Paid | Tax Assessment Tax Assessment Total Assessment is a certain percentage of the fair market value that is determined by local assessors to be the total taxable value of land and additions on the property. | Land | Improvement |
|---|---|---|---|---|
| 2024 | $1,551 | $65,260 | $5,160 | $60,100 |
| 2023 | $1,852 | $44,700 | $3,720 | $40,980 |
| 2022 | $1,630 | $44,984 | $3,720 | $41,264 |
| 2021 | $1,331 | $44,984 | $3,720 | $41,264 |
| 2020 | $1,336 | $45,016 | $3,720 | $41,296 |
| 2019 | $1,296 | $45,016 | $3,720 | $41,296 |
| 2018 | $1,272 | $44,056 | $3,720 | $40,336 |
| 2017 | $1,246 | $44,520 | $3,720 | $40,800 |
| 2016 | $1,139 | $40,280 | $3,720 | $36,560 |
| 2015 | -- | $47,160 | $3,720 | $43,440 |
| 2014 | -- | $47,160 | $3,720 | $43,440 |
| 2013 | -- | $48,120 | $3,720 | $44,400 |
Source: Public Records
Map
Nearby Homes
- 308 Old Metter Rd
- 0 Dublin Rd
- 610 W Liberty St
- 6 N Spring St
- 3 S Spring St
- 511 W Smith St
- 107 Marguerite St
- 606 Park Ave
- 0 Turnpike Rd Unit SA339603
- 415 Burkhalter Cir
- 0 Ga Hwy 129 N Unit 10564606
- 19 Wysteria Ln
- 201 New Dr
- 320 N Duval St
- 9 Honeysuckle Dr
- 12 S Duval St
- 10 Honeysuckle Dr
- 107 E Liberty St
- 3 Honeysuckle Dr
- 19 Collins St
- 202 202 Stewart St
- 801 Womble St
- 112 N College St
- 202 Stewart St
- 0 Stewart St Unit 8481721
- 0 Stewart St Unit 8205104
- 0 Stewart St Unit 8111988
- 0 Stewart St
- 206 N College St
- 110 N College St
- 205 Stewart St
- 00 Womble St
- 107 Stewart St
- 206 Stewart St
- 106 N College St
- 210 N College St
- N N College St
- 108 Stewart St
- 201 N College St
- 103 Stewart St