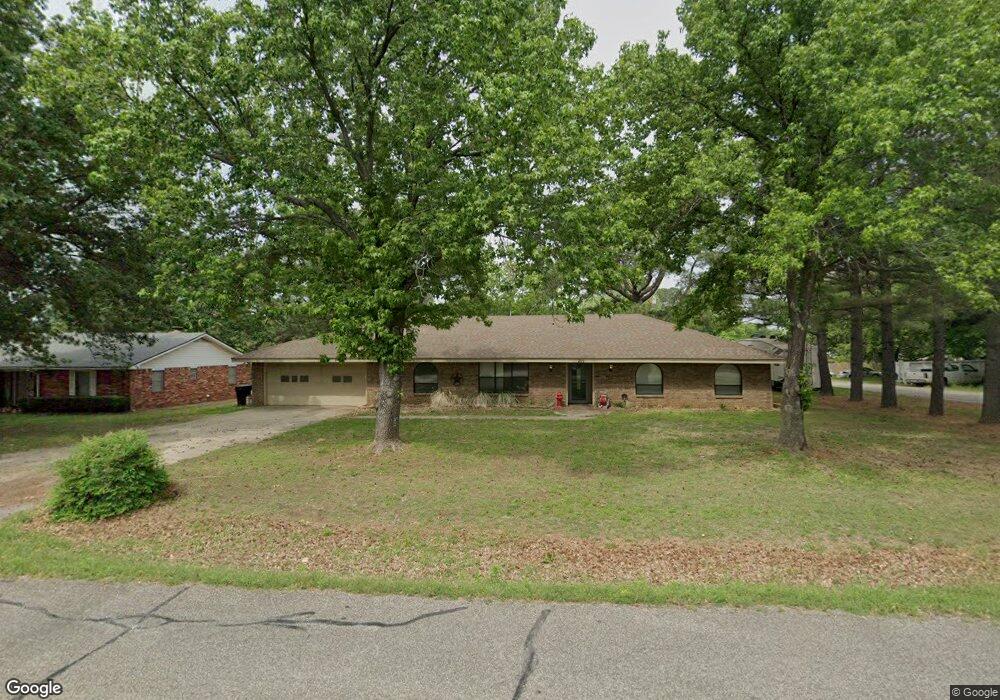
201 Sunnymeadow Dr Durant, OK 74701
Estimated Value: $222,000 - $314,000
4
Beds
2
Baths
2,424
Sq Ft
$113/Sq Ft
Est. Value
About This Home
This home is located at 201 Sunnymeadow Dr, Durant, OK 74701 and is currently estimated at $273,743, approximately $112 per square foot. 201 Sunnymeadow Dr is a home located in Bryan County with nearby schools including Northwest Heights Elementary School, Durant Intermediate Elementary School, and Durant Middle School.
Ownership History
Date
Name
Owned For
Owner Type
Purchase Details
Closed on
Nov 4, 2019
Sold by
Nunnally Juston
Bought by
Nunnally Jonathan and Nunnally Keely
Current Estimated Value
Purchase Details
Closed on
Aug 19, 2011
Sold by
Dufur Josh and Dufur Dachia
Bought by
Nunnally Jonathan W and Nunnally Keely Rebecca
Home Financials for this Owner
Home Financials are based on the most recent Mortgage that was taken out on this home.
Original Mortgage
$160,792
Outstanding Balance
$110,568
Interest Rate
4.5%
Mortgage Type
FHA
Estimated Equity
$163,175
Purchase Details
Closed on
Apr 12, 2007
Sold by
Burkett Darren Scott and Burkett Cheyl
Bought by
Dufur Josh and Dufur Dachia
Home Financials for this Owner
Home Financials are based on the most recent Mortgage that was taken out on this home.
Original Mortgage
$111,600
Interest Rate
6.19%
Mortgage Type
New Conventional
Create a Home Valuation Report for This Property
The Home Valuation Report is an in-depth analysis detailing your home's value as well as a comparison with similar homes in the area
Home Values in the Area
Average Home Value in this Area
Purchase History
| Date | Buyer | Sale Price | Title Company |
|---|---|---|---|
| Nunnally Jonathan | -- | None Available | |
| Nunnally Jonathan W | $165,000 | None Available | |
| Dufur Josh | $124,000 | None Available |
Source: Public Records
Mortgage History
| Date | Status | Borrower | Loan Amount |
|---|---|---|---|
| Open | Nunnally Jonathan W | $160,792 | |
| Previous Owner | Dufur Josh | $111,600 |
Source: Public Records
Tax History Compared to Growth
Tax History
| Year | Tax Paid | Tax Assessment Tax Assessment Total Assessment is a certain percentage of the fair market value that is determined by local assessors to be the total taxable value of land and additions on the property. | Land | Improvement |
|---|---|---|---|---|
| 2025 | $1,859 | $20,695 | $2,200 | $18,495 |
| 2024 | $1,859 | $20,093 | $2,200 | $17,893 |
| 2023 | $1,859 | $19,508 | $2,200 | $17,308 |
| 2022 | $1,738 | $19,508 | $2,200 | $17,308 |
| 2021 | $1,780 | $19,508 | $2,200 | $17,308 |
| 2020 | $1,778 | $19,508 | $2,200 | $17,308 |
| 2019 | $1,675 | $19,474 | $2,200 | $17,274 |
| 2018 | $1,609 | $18,907 | $2,200 | $16,707 |
| 2017 | $1,550 | $18,357 | $2,200 | $16,157 |
| 2016 | $1,581 | $18,559 | $1,925 | $16,634 |
| 2015 | $1,539 | $18,150 | $1,320 | $16,830 |
| 2014 | $1,537 | $18,150 | $1,320 | $16,830 |
Source: Public Records
Map
Nearby Homes
- 212 Sandpiper Cir
- 511 Meadowlark Ln
- 3701 Dawna St
- 3609 Dawna St
- 3601 Dana Dr
- 105 Quail Ridge Rd
- 116 Quail Ridge Rd
- 5 Christopher Way
- 6 Prosper St
- 5 Prosper St
- 10 Prosper St
- 7 Prosper St
- 9 Prosper St
- 7 Christopher Way
- 0 Criswell Blvd Unit 2526619
- 0 Criswell Blvd Unit 2526521
- 13 Christopher Way
- 8 Prosper St
- 12 Christopher Way
- 4709 Sunnyside Rd
- 207 Sunnymeadow Dr
- 207 Sunny Meadows
- 121 Sunnymeadow Dr
- 209 Sunnymeadow Dr
- 202 Lynn Haven Dr
- 202 Sunnymeadow Dr
- 206 Lynn Haven Dr
- 118 Sunnymeadow Dr
- 504 Sunnymeadow Dr
- 115 Sunnymeadow Dr
- 120 Lynn Haven Dr
- 116 Sunnymeadow Dr
- 208 Lynn Haven Dr
- 211 Sunnymeadow Dr
- 211 Sunny Meadows
- 208 Sunnymeadow Dr
- 208 Sunny Meadows
- 111 Sunnymeadow Dr
- 114 Meadowlark Ln
- 116 Meadowlark Ln