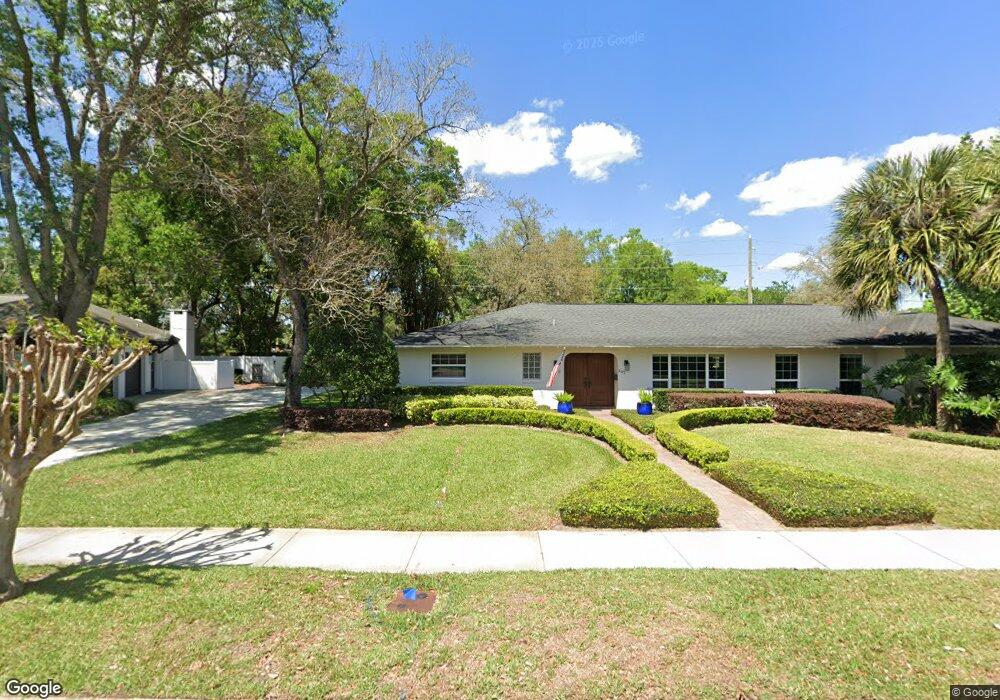
201 Talmeda Trail Maitland, FL 32751
Estimated Value: $766,000 - $946,000
5
Beds
3
Baths
2,899
Sq Ft
$294/Sq Ft
Est. Value
About This Home
This home is located at 201 Talmeda Trail, Maitland, FL 32751 and is currently estimated at $852,718, approximately $294 per square foot. 201 Talmeda Trail is a home located in Orange County with nearby schools including Lake Sybelia Elementary School, Maitland Middle School, and Edgewater High School.
Ownership History
Date
Name
Owned For
Owner Type
Purchase Details
Closed on
Feb 2, 2023
Sold by
Shear Mark D and Shear Abigail J
Bought by
Shear Mark D
Current Estimated Value
Purchase Details
Closed on
Jul 31, 2003
Sold by
Robinson David M and Robinson Angela B
Bought by
Shear Mark D and Shear Abigail J
Home Financials for this Owner
Home Financials are based on the most recent Mortgage that was taken out on this home.
Original Mortgage
$305,000
Interest Rate
4.87%
Mortgage Type
Purchase Money Mortgage
Purchase Details
Closed on
Feb 3, 1999
Sold by
Powell Charles C and Powell Angeli G
Bought by
Robinson David M and Robinson Angela B
Home Financials for this Owner
Home Financials are based on the most recent Mortgage that was taken out on this home.
Original Mortgage
$200,000
Interest Rate
6.8%
Mortgage Type
New Conventional
Create a Home Valuation Report for This Property
The Home Valuation Report is an in-depth analysis detailing your home's value as well as a comparison with similar homes in the area
Home Values in the Area
Average Home Value in this Area
Purchase History
| Date | Buyer | Sale Price | Title Company |
|---|---|---|---|
| Shear Mark D | $100 | -- | |
| Shear Mark D | $381,500 | Fidelity National Title Insu | |
| Robinson David M | $250,000 | -- |
Source: Public Records
Mortgage History
| Date | Status | Borrower | Loan Amount |
|---|---|---|---|
| Previous Owner | Shear Mark D | $305,000 | |
| Previous Owner | Robinson David M | $200,000 | |
| Closed | Shear Mark D | $56,400 |
Source: Public Records
Tax History Compared to Growth
Tax History
| Year | Tax Paid | Tax Assessment Tax Assessment Total Assessment is a certain percentage of the fair market value that is determined by local assessors to be the total taxable value of land and additions on the property. | Land | Improvement |
|---|---|---|---|---|
| 2025 | $4,714 | $338,395 | -- | -- |
| 2024 | $4,518 | $338,395 | -- | -- |
| 2023 | $4,518 | $319,280 | $0 | $0 |
| 2022 | $4,232 | $309,981 | $0 | $0 |
| 2021 | $4,177 | $300,952 | $0 | $0 |
| 2020 | $3,984 | $296,797 | $0 | $0 |
| 2019 | $4,118 | $290,124 | $0 | $0 |
| 2018 | $4,091 | $284,714 | $0 | $0 |
| 2017 | $4,044 | $337,754 | $99,750 | $238,004 |
| 2016 | $3,999 | $333,663 | $99,750 | $233,913 |
| 2015 | $4,076 | $362,700 | $95,000 | $267,700 |
| 2014 | $4,104 | $286,899 | $95,000 | $191,899 |
Source: Public Records
Map
Nearby Homes
- 104 E Lake Colony Dr
- 1277 Blessing St
- 1291 Blessing St
- 1100 Willowbrook Trail
- 380 White Oak Cir
- 1416 Caring Ct
- 800 Thompson Ave
- 711 Thompson Ave
- 2031 Warrens Ave
- 840 Mulberry St
- 2031 Eaton St
- 755 Cranes Ct
- 320 Eaton St
- 301 Clark St
- 731 Bucher Rd
- 1518 Oranole Rd
- 840 Bethune Dr
- 1501 Oranole Rd
- 860 Park Lake Cir Unit 53
- 255 W George Ave
- 211 Talmeda Trail
- 161 Talmeda Trail
- 1180 Banbury Trail
- 1191 Covewood Trail
- 151 Talmeda Trail
- 1170 Banbury Trail
- 1181 Covewood Trail
- 1181 Banbury Trail
- 1190 Covewood Trail
- 141 Talmeda Trail
- 1190 Rollingwood Trail
- 1160 Banbury Trail
- 1180 Covewood Trail
- 1180 Rollingwood Trail
- 1171 Banbury Trail
- 241 Talmeda Trail
- 1201 Willa Vista Trail
- 131 Talmeda Trail
- 1440 Rollingwood Trail
- 1170 Covewood Trail