201 Townsend Place NW Unit 201 Atlanta, GA 30327
Paces NeighborhoodEstimated Value: $867,000 - $1,083,000
3
Beds
4
Baths
3,024
Sq Ft
$315/Sq Ft
Est. Value
About This Home
This home is located at 201 Townsend Place NW Unit 201, Atlanta, GA 30327 and is currently estimated at $953,658, approximately $315 per square foot. 201 Townsend Place NW Unit 201 is a home located in Fulton County with nearby schools including Jackson Elementary School, Sutton Middle School, and North Atlanta High School.
Ownership History
Date
Name
Owned For
Owner Type
Purchase Details
Closed on
Oct 25, 2024
Sold by
Shuler Robert K
Bought by
Robert & Sarah Shuler Revocable Living T and Shuler Robert Keith Sr Tr
Current Estimated Value
Purchase Details
Closed on
Sep 14, 2015
Sold by
Nichols Mary D
Bought by
Shuler Robert K and Shuler Sarah E
Purchase Details
Closed on
Aug 21, 2014
Sold by
Mcqueen C Richard
Bought by
Nichols Mary D
Purchase Details
Closed on
Aug 15, 2003
Sold by
Mcqueen C Richard
Bought by
Mcqueen Mcqueen C and Mcqueen Karen
Home Financials for this Owner
Home Financials are based on the most recent Mortgage that was taken out on this home.
Original Mortgage
$562,500
Interest Rate
6.13%
Mortgage Type
New Conventional
Purchase Details
Closed on
Mar 14, 1994
Sold by
Fry Kenneth L Bar
Bought by
Mcqueen C Richard
Home Financials for this Owner
Home Financials are based on the most recent Mortgage that was taken out on this home.
Original Mortgage
$280,000
Interest Rate
6.97%
Create a Home Valuation Report for This Property
The Home Valuation Report is an in-depth analysis detailing your home's value as well as a comparison with similar homes in the area
Home Values in the Area
Average Home Value in this Area
Purchase History
| Date | Buyer | Sale Price | Title Company |
|---|---|---|---|
| Robert & Sarah Shuler Revocable Living T | -- | -- | |
| Shuler Robert K | $630,000 | -- | |
| Nichols Mary D | $640,000 | -- | |
| Mcqueen Mcqueen C | -- | -- | |
| Mcqueen C Richard | $350,000 | -- |
Source: Public Records
Mortgage History
| Date | Status | Borrower | Loan Amount |
|---|---|---|---|
| Previous Owner | Mcqueen Mcqueen C | $562,500 | |
| Previous Owner | Mcqueen C Richard | $280,000 |
Source: Public Records
Tax History Compared to Growth
Tax History
| Year | Tax Paid | Tax Assessment Tax Assessment Total Assessment is a certain percentage of the fair market value that is determined by local assessors to be the total taxable value of land and additions on the property. | Land | Improvement |
|---|---|---|---|---|
| 2025 | $6,856 | $371,560 | $42,360 | $329,200 |
| 2023 | $10,598 | $256,000 | $41,400 | $214,600 |
| 2022 | $8,603 | $256,000 | $41,400 | $214,600 |
| 2021 | $8,616 | $256,000 | $41,400 | $214,600 |
| 2020 | $8,547 | $252,000 | $32,480 | $219,520 |
| 2019 | $133 | $252,000 | $32,480 | $219,520 |
| 2018 | $9,905 | $281,480 | $32,480 | $249,000 |
| 2017 | $10,884 | $252,000 | $29,840 | $222,160 |
| 2016 | $10,912 | $252,000 | $29,840 | $222,160 |
| 2015 | $8,001 | $184,320 | $21,840 | $162,480 |
| 2014 | $5,928 | $160,000 | $21,840 | $138,160 |
Source: Public Records
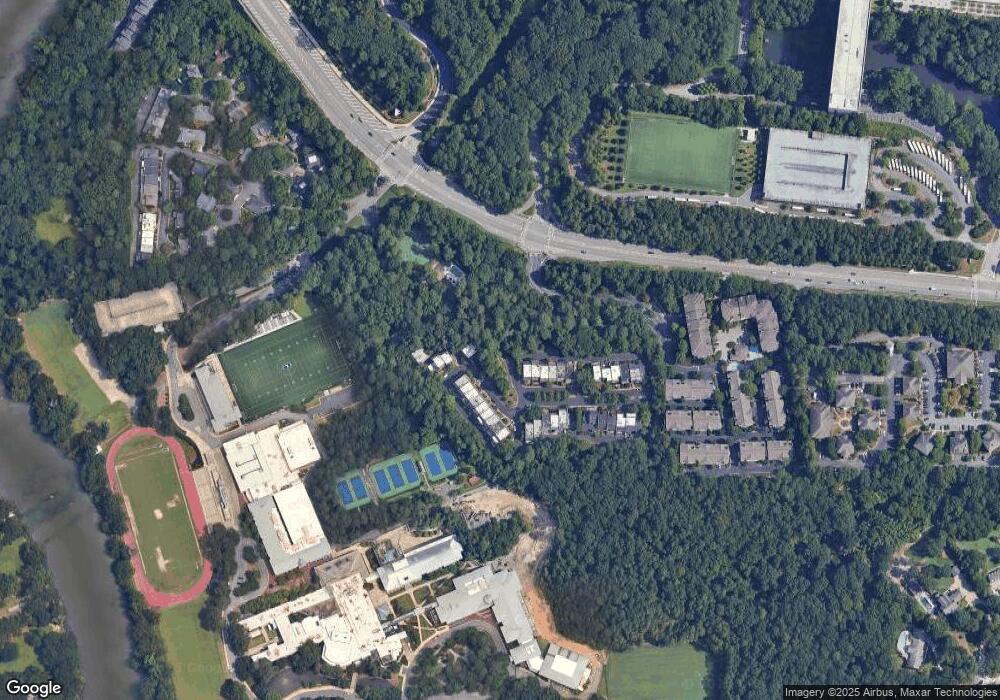
Map
Nearby Homes
- 2306 River Green Dr NW
- 1201 River Green Dr NW
- 1209 River Green Dr NW
- 4248 River Green Dr NW Unit 312
- 4248 River Green Dr NW Unit 307
- 2405 River Green Dr NW Unit 2405
- 1406 River Green Dr NW
- 4248 River Green Dr NW Unit 310
- 1105 River Green Dr NW
- 4254 River Green Dr NW Unit 608
- 4244 River Green Dr NW Unit 111
- 4411 Paces Battle NW
- 3990 Paces Ferry Rd NW
- 3906 Paces Ferry Rd NW
- 1919 River Forest Rd NW
- 2079 Old Settlement Rd NW
- 4220 Paces Ferry Rd SE
- 3337 Cochise Dr SE
- 3191 Lemons Ridge
- 3201 Teton Dr SE
- 201 Townsend Place NW
- 202 Townsend Place NW Unit 202
- 203 Townsend Place NW
- 204 Townsend Place NW Unit 204
- 401 Townsend Place NW
- 205 Townsend Place NW
- 402 Townsend Place NW
- 1920 Townsend Place NW
- 1916 Townsend Place NW Unit 4
- 1916 Townsend Place NW
- 1914 Townsend Place NW Unit 3
- 1914 Townsend Place NW
- 206 Townsend Place NW
- 403 Townsend Place NW
- 403 Townsend Place NW
- 207 Townsend Place NW Unit 207
- 404 Townsend Place NW
- 208 Townsend Place NW
- 405 Townsend Place NW
- 209 Townsend Place NW