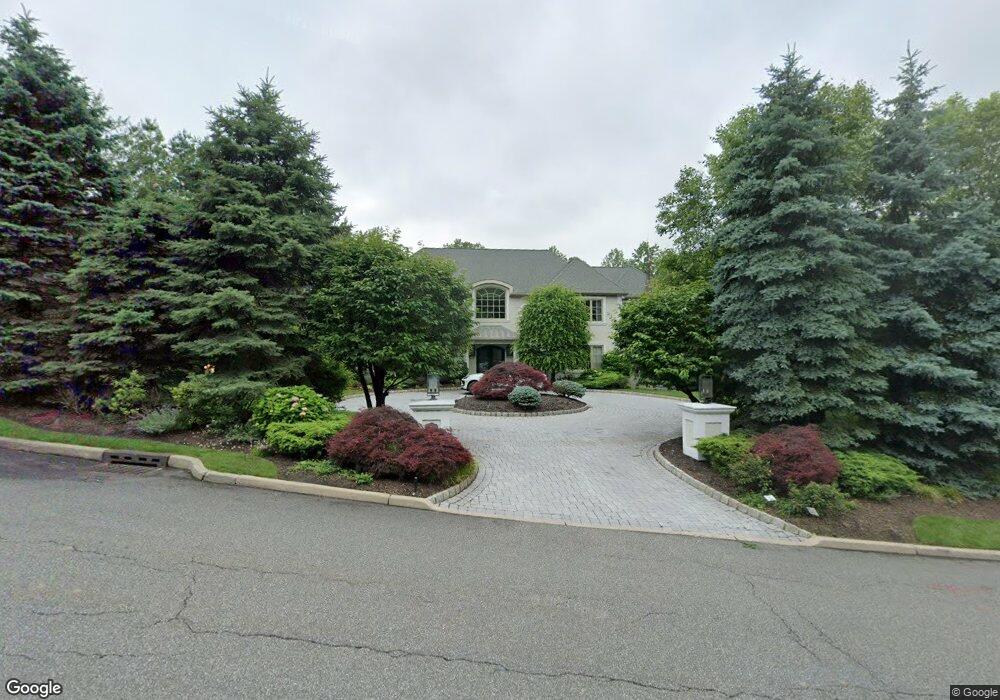
201 Truman Dr Cresskill, NJ 07626
Estimated Value: $2,600,000 - $3,493,000
Studio
--
Bath
6,060
Sq Ft
$525/Sq Ft
Est. Value
About This Home
This home is located at 201 Truman Dr, Cresskill, NJ 07626 and is currently estimated at $3,178,554, approximately $524 per square foot. 201 Truman Dr is a home located in Bergen County with nearby schools including Cresskill High School, Spring School, and Academy Of The Holy Angels.
Ownership History
Date
Name
Owned For
Owner Type
Purchase Details
Closed on
Jul 29, 2004
Sold by
Nanwani Suresh
Bought by
Christodoulou Evan and Christodoulou Fotini
Current Estimated Value
Home Financials for this Owner
Home Financials are based on the most recent Mortgage that was taken out on this home.
Original Mortgage
$999,900
Outstanding Balance
$506,662
Interest Rate
6.33%
Estimated Equity
$2,671,892
Create a Home Valuation Report for This Property
The Home Valuation Report is an in-depth analysis detailing your home's value as well as a comparison with similar homes in the area
Home Values in the Area
Average Home Value in this Area
Purchase History
| Date | Buyer | Sale Price | Title Company |
|---|---|---|---|
| Christodoulou Evan | $2,500,000 | -- |
Source: Public Records
Mortgage History
| Date | Status | Borrower | Loan Amount |
|---|---|---|---|
| Open | Christodoulou Evan | $999,900 |
Source: Public Records
Tax History
| Year | Tax Paid | Tax Assessment Tax Assessment Total Assessment is a certain percentage of the fair market value that is determined by local assessors to be the total taxable value of land and additions on the property. | Land | Improvement |
|---|---|---|---|---|
| 2025 | $53,434 | $2,430,300 | $652,000 | $1,778,300 |
| 2024 | $52,176 | $2,323,200 | $607,000 | $1,716,200 |
| 2023 | $51,628 | $2,248,000 | $574,500 | $1,673,500 |
| 2022 | $51,628 | $2,144,900 | $534,500 | $1,610,400 |
| 2021 | $50,886 | $2,083,800 | $517,000 | $1,566,800 |
| 2020 | $50,036 | $2,057,400 | $514,500 | $1,542,900 |
| 2019 | $50,030 | $2,078,500 | $512,000 | $1,566,500 |
| 2018 | $35,467 | $2,103,600 | $504,500 | $1,599,100 |
| 2017 | $45,825 | $1,683,500 | $507,500 | $1,176,000 |
| 2016 | $44,461 | $1,683,500 | $507,500 | $1,176,000 |
| 2015 | $43,081 | $1,683,500 | $507,500 | $1,176,000 |
| 2014 | $41,784 | $1,683,500 | $507,500 | $1,176,000 |
Source: Public Records
Map
Nearby Homes
Your Personal Tour Guide
Ask me questions while you tour the home.