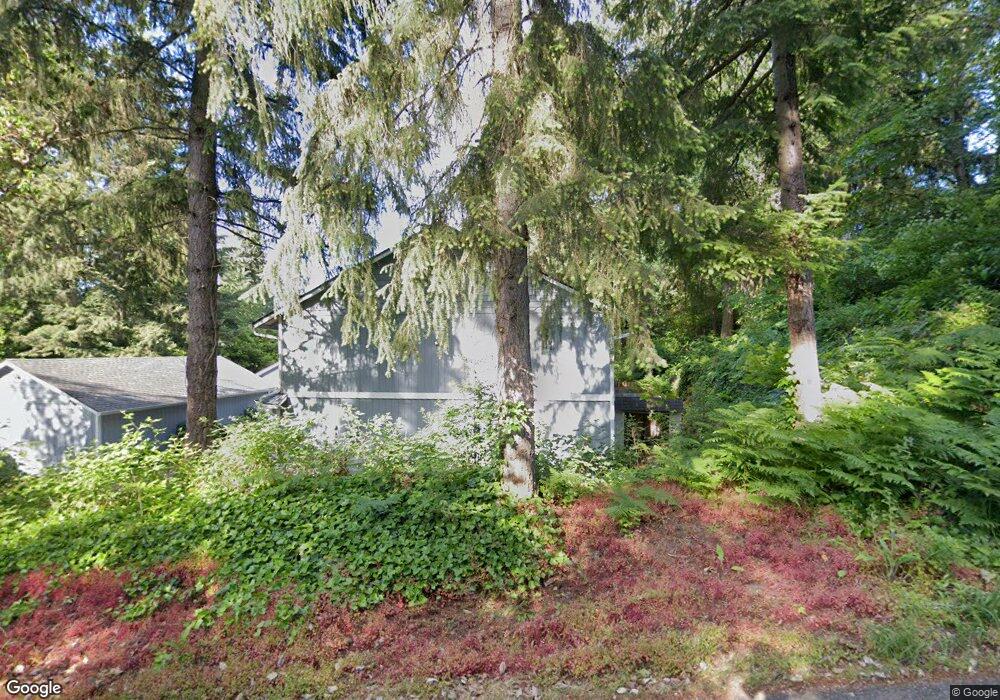
201 View Rd Unit 201 Steilacoom, WA 98388
Estimated Value: $335,000 - $382,000
2
Beds
2
Baths
1,174
Sq Ft
$309/Sq Ft
Est. Value
About This Home
This home is located at 201 View Rd Unit 201, Steilacoom, WA 98388 and is currently estimated at $363,317, approximately $309 per square foot. 201 View Rd Unit 201 is a home located in Pierce County with nearby schools including Cherrydale Elementary School, Saltars Point Elementary School, and Pioneer Middle School.
Ownership History
Date
Name
Owned For
Owner Type
Purchase Details
Closed on
Oct 25, 2021
Sold by
Thompson Carmel D
Bought by
Thompson Carmel D and Bachmeier Tammie M
Current Estimated Value
Purchase Details
Closed on
Oct 26, 2007
Sold by
Markussen Hans C
Bought by
Thompson Carmel D
Home Financials for this Owner
Home Financials are based on the most recent Mortgage that was taken out on this home.
Original Mortgage
$177,500
Interest Rate
6.29%
Mortgage Type
Purchase Money Mortgage
Purchase Details
Closed on
Nov 29, 1995
Sold by
View Road Developments Inc
Bought by
Markussen Hans C
Home Financials for this Owner
Home Financials are based on the most recent Mortgage that was taken out on this home.
Original Mortgage
$76,750
Interest Rate
7.42%
Mortgage Type
FHA
Create a Home Valuation Report for This Property
The Home Valuation Report is an in-depth analysis detailing your home's value as well as a comparison with similar homes in the area
Home Values in the Area
Average Home Value in this Area
Purchase History
| Date | Buyer | Sale Price | Title Company |
|---|---|---|---|
| Thompson Carmel D | -- | None Listed On Document | |
| Thompson Carmel D | $183,000 | Rainier Title | |
| Markussen Hans C | $91,326 | Chicago Title |
Source: Public Records
Mortgage History
| Date | Status | Borrower | Loan Amount |
|---|---|---|---|
| Previous Owner | Thompson Carmel D | $177,500 | |
| Previous Owner | Markussen Hans C | $76,750 |
Source: Public Records
Tax History
| Year | Tax Paid | Tax Assessment Tax Assessment Total Assessment is a certain percentage of the fair market value that is determined by local assessors to be the total taxable value of land and additions on the property. | Land | Improvement |
|---|---|---|---|---|
| 2025 | $2,629 | $337,600 | $183,500 | $154,100 |
| 2024 | $2,629 | $335,700 | $169,500 | $166,200 |
| 2023 | $2,629 | $304,400 | $164,500 | $139,900 |
| 2022 | $2,649 | $323,700 | $169,600 | $154,100 |
| 2021 | $2,294 | $212,200 | $115,100 | $97,100 |
| 2019 | $1,838 | $197,200 | $102,800 | $94,400 |
| 2018 | $1,518 | $165,300 | $80,200 | $85,100 |
| 2017 | $1,343 | $118,800 | $53,500 | $65,300 |
| 2016 | $1,675 | $109,100 | $41,900 | $67,200 |
| 2014 | $1,538 | $130,100 | $42,900 | $87,200 |
| 2013 | $1,538 | $98,800 | $29,300 | $69,500 |
Source: Public Records
Map
Nearby Homes
- 2802 Garden Ct Unit A
- 61 Leschi Dr
- 10710 97th St SW
- 710 Roe St
- 38 Puget Dr
- 2312 Lafayette St
- 2805 Chambers Bay Dr
- 10202 98th St SW
- 2781 Chambers Point Ct
- 10014 108th Ave SW
- 2514 Shepard St
- 715 Stevens St
- 2005 Nisqually St
- 303 Puyallup St
- 728 Blaine St
- 9814 Onyx Dr SW
- 2009 Nisqually St
- 9802 Onyx Dr SW
- 1514 Rainier St
- 10207 Melody Ln SW
- 205 Rigney Rd
- 203 View Rd Unit 203
- 205 View Rd Unit U-205
- 205 View Rd Unit 205U
- 2898 Rigney Rd
- 207 View Rd Unit 207
- 209 View Rd Unit 209
- 2826 Garden Ct Unit D
- 2826 Garden Ct Unit C
- 2826 Garden Ct Unit B
- 2826 Garden Ct Unit A
- 2826 Garden Ct Unit B
- 2831 Marietta St
- 2818 Garden Ct Unit D
- 2818 Garden Ct Unit C
- 2818 Garden Ct Unit B
- 2818 Garden Ct Unit A
- 121 View Rd
- 2833 Marietta St
- 2824 Garden Ct Unit D
Your Personal Tour Guide
Ask me questions while you tour the home.