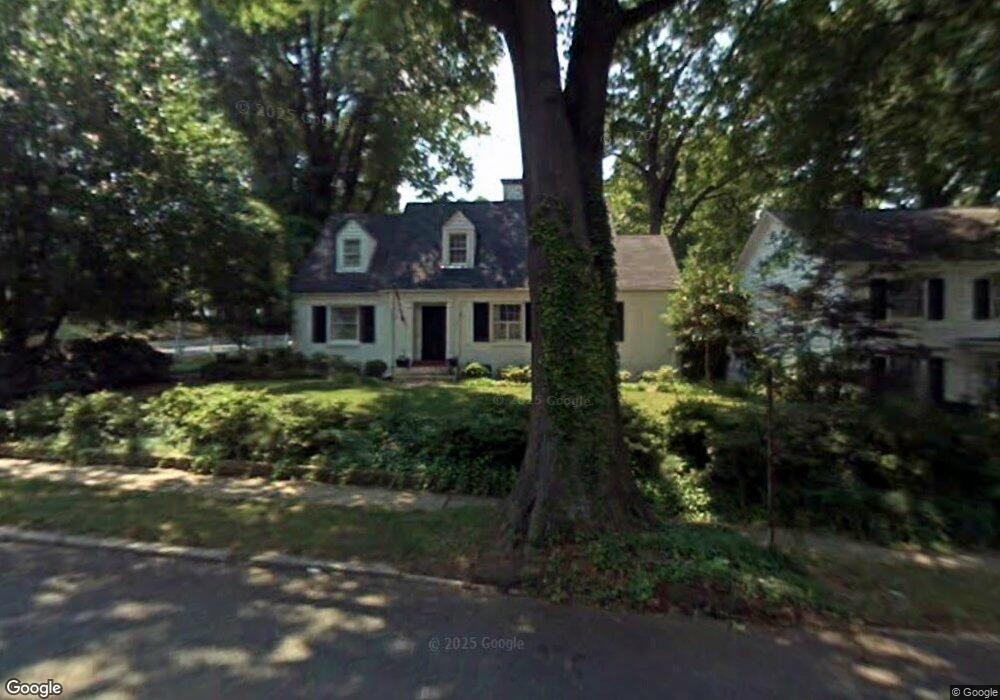
201 W 5th Ave Unit 2 Gastonia, NC 28052
Estimated Value: $341,222 - $392,000
3
Beds
3
Baths
2,043
Sq Ft
$176/Sq Ft
Est. Value
About This Home
This home is located at 201 W 5th Ave Unit 2, Gastonia, NC 28052 and is currently estimated at $359,056, approximately $175 per square foot. 201 W 5th Ave Unit 2 is a home located in Gaston County with nearby schools including Sherwood Elementary School, York Chester Middle School, and Hunter Huss High School.
Ownership History
Date
Name
Owned For
Owner Type
Purchase Details
Closed on
Dec 19, 2018
Sold by
Edwards Patrick A
Bought by
Zack Timothy F and Zack Julee L
Current Estimated Value
Home Financials for this Owner
Home Financials are based on the most recent Mortgage that was taken out on this home.
Original Mortgage
$202,350
Outstanding Balance
$178,630
Interest Rate
4.9%
Mortgage Type
New Conventional
Estimated Equity
$180,426
Purchase Details
Closed on
Jun 2, 2015
Sold by
Edwards Laura Wright Anderson and Edwards Laura Wright
Bought by
Edwards Patrick A
Purchase Details
Closed on
May 3, 2002
Sold by
Dolman Jack Allan and Dolman Marietta B
Bought by
Edwards Patrick A and Edwards Laura Wright
Home Financials for this Owner
Home Financials are based on the most recent Mortgage that was taken out on this home.
Original Mortgage
$155,400
Interest Rate
7.16%
Create a Home Valuation Report for This Property
The Home Valuation Report is an in-depth analysis detailing your home's value as well as a comparison with similar homes in the area
Home Values in the Area
Average Home Value in this Area
Purchase History
| Date | Buyer | Sale Price | Title Company |
|---|---|---|---|
| Zack Timothy F | $213,000 | None Available | |
| Edwards Patrick A | -- | Attorney | |
| Edwards Patrick A | $164,000 | -- |
Source: Public Records
Mortgage History
| Date | Status | Borrower | Loan Amount |
|---|---|---|---|
| Open | Zack Timothy F | $202,350 | |
| Previous Owner | Edwards Patrick A | $155,400 |
Source: Public Records
Tax History Compared to Growth
Tax History
| Year | Tax Paid | Tax Assessment Tax Assessment Total Assessment is a certain percentage of the fair market value that is determined by local assessors to be the total taxable value of land and additions on the property. | Land | Improvement |
|---|---|---|---|---|
| 2025 | $3,114 | $291,330 | $30,000 | $261,330 |
| 2024 | $3,114 | $291,330 | $30,000 | $261,330 |
| 2023 | $3,675 | $340,320 | $30,000 | $310,320 |
| 2022 | $2,758 | $207,360 | $24,000 | $183,360 |
| 2021 | $2,799 | $207,360 | $24,000 | $183,360 |
| 2019 | $2,812 | $206,740 | $24,000 | $182,740 |
| 2018 | $2,303 | $164,515 | $24,000 | $140,515 |
| 2017 | $2,303 | $164,515 | $24,000 | $140,515 |
| 2016 | $2,303 | $164,515 | $0 | $0 |
| 2014 | $2,132 | $152,282 | $30,000 | $122,282 |
Source: Public Records
Map
Nearby Homes