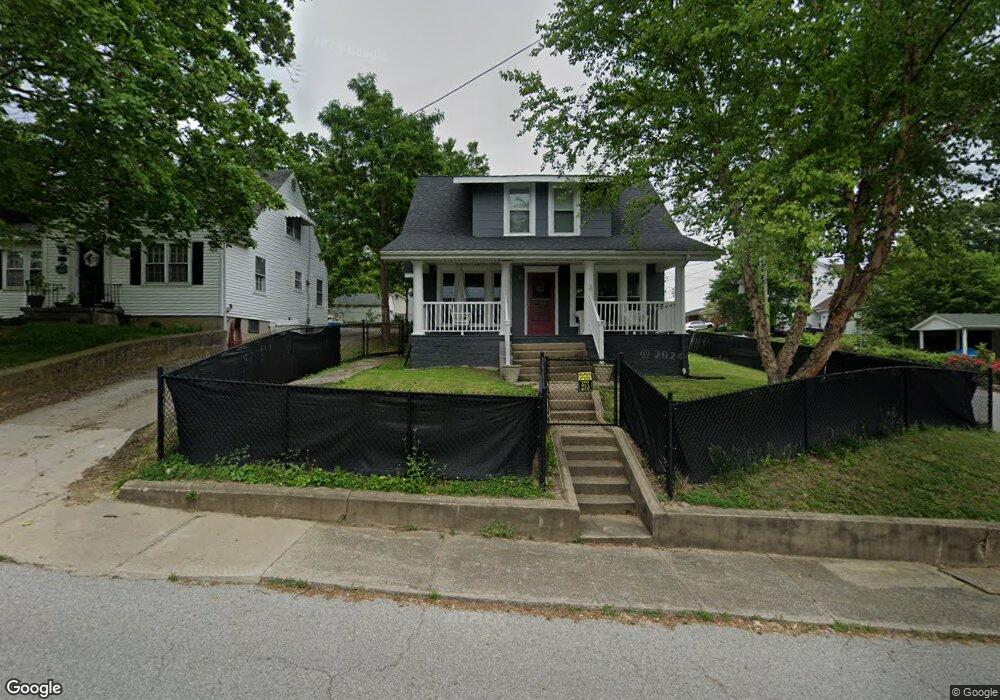
201 W High St Springfield, KY 40069
Estimated Value: $173,000 - $209,000
3
Beds
2
Baths
1,616
Sq Ft
$116/Sq Ft
Est. Value
About This Home
This home is located at 201 W High St, Springfield, KY 40069 and is currently estimated at $186,816, approximately $115 per square foot. 201 W High St is a home located in Washington County with nearby schools including Washington County Elementary School, North Washington Elementary School, and Washington County Middle School.
Ownership History
Date
Name
Owned For
Owner Type
Purchase Details
Closed on
May 13, 2022
Sold by
Elane Greene Shonnie
Bought by
Keith Eric D
Current Estimated Value
Home Financials for this Owner
Home Financials are based on the most recent Mortgage that was taken out on this home.
Original Mortgage
$6,000
Outstanding Balance
$4,197
Interest Rate
4.48%
Estimated Equity
$182,619
Purchase Details
Closed on
Mar 24, 2017
Sold by
Maupin Kristin P
Bought by
Medley Shonnie Elane
Purchase Details
Closed on
Sep 21, 2012
Sold by
Perry Mark and Perry Elizabeth
Bought by
Riley Christina M
Purchase Details
Closed on
Feb 8, 2010
Sold by
Craven James D and Craven Fran
Bought by
Riley Christina M
Home Financials for this Owner
Home Financials are based on the most recent Mortgage that was taken out on this home.
Original Mortgage
$65,250
Interest Rate
5.07%
Mortgage Type
Future Advance Clause Open End Mortgage
Create a Home Valuation Report for This Property
The Home Valuation Report is an in-depth analysis detailing your home's value as well as a comparison with similar homes in the area
Home Values in the Area
Average Home Value in this Area
Purchase History
| Date | Buyer | Sale Price | Title Company |
|---|---|---|---|
| Keith Eric D | $157,200 | Bluegrass Land Title | |
| Medley Shonnie Elane | $87,550 | None Available | |
| Riley Christina M | $129,900 | None Available | |
| Riley Christina M | $72,500 | None Available |
Source: Public Records
Mortgage History
| Date | Status | Borrower | Loan Amount |
|---|---|---|---|
| Open | Keith Eric D | $6,000 | |
| Open | Keith Eric D | $154,352 | |
| Previous Owner | Riley Christina M | $65,250 |
Source: Public Records
Tax History
| Year | Tax Paid | Tax Assessment Tax Assessment Total Assessment is a certain percentage of the fair market value that is determined by local assessors to be the total taxable value of land and additions on the property. | Land | Improvement |
|---|---|---|---|---|
| 2025 | $1,502 | $157,200 | $0 | $0 |
| 2024 | $1,539 | $157,200 | $0 | $0 |
| 2023 | $1,564 | $157,200 | $0 | $0 |
| 2022 | $881 | $87,550 | $0 | $0 |
| 2021 | $894 | $87,550 | $0 | $0 |
| 2020 | $903 | $87,550 | $0 | $0 |
| 2019 | $908 | $87,550 | $0 | $0 |
| 2018 | $906 | $87,550 | $0 | $0 |
| 2017 | $897 | $87,550 | $0 | $87,550 |
| 2016 | $772 | $75,000 | $0 | $0 |
| 2014 | $736 | $75,000 | $0 | $75,000 |
| 2010 | -- | $72,500 | $0 | $72,500 |
Source: Public Records
Map
Nearby Homes
- 208 W Virginia Ave
- 220 W Main St
- 500 N Doctor St
- 206 N Walnut St
- 402 N Walnut St
- 401 N Walnut St
- 204 E Virginia Ave
- 203 Commercial Ave
- 256 Eagle Ridge Way
- 501 W Main St
- 503 W Main St
- 123 Lebanon Hill
- 516 N Walnut St
- 212 Covington Ave
- 328 E Main St
- 308 Covington Ave
- 153 Armory Hill
- 300 E Grundy Ave
- 119 Short St
- 204 Armory Hill
- 203 W High St
- 302 N Doctor St
- 115 W High St
- 113 W High St
- 304 N Doctor St
- 204 W High St
- 207 N Doctor St
- 303 N Doctor St
- 207 W High St Unit 205
- 206 W High St
- 111 W High St
- 205 N Doctor St
- 202 N Doctor St
- 200 N Doctor St
- 306 N Doctor St
- 110 W High St
- 218 W Mccord St
- 213 W High St
- 109 W High St
- 108 W High St
Your Personal Tour Guide
Ask me questions while you tour the home.