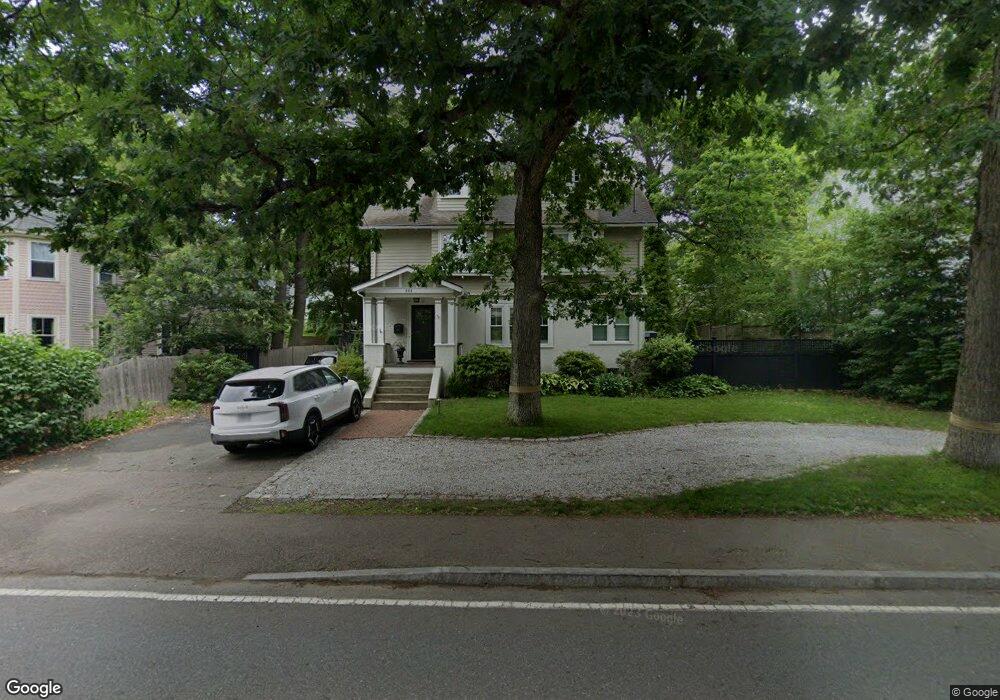
201 Weston Rd Wellesley, MA 02482
Wellesley Square NeighborhoodEstimated Value: $1,776,000 - $2,131,265
4
Beds
3
Baths
2,408
Sq Ft
$800/Sq Ft
Est. Value
About This Home
This home is located at 201 Weston Rd, Wellesley, MA 02482 and is currently estimated at $1,927,566, approximately $800 per square foot. 201 Weston Rd is a home located in Norfolk County with nearby schools including John D. Hardy Elementary School, Wellesley Middle School, and Wellesley Sr High School.
Ownership History
Date
Name
Owned For
Owner Type
Purchase Details
Closed on
Jun 6, 2024
Sold by
Haven Development Llc
Bought by
South Street Lot 5 Llc
Current Estimated Value
Home Financials for this Owner
Home Financials are based on the most recent Mortgage that was taken out on this home.
Original Mortgage
$2,112,000
Outstanding Balance
$2,082,141
Interest Rate
7.17%
Mortgage Type
Purchase Money Mortgage
Estimated Equity
-$154,575
Purchase Details
Closed on
Feb 13, 2009
Sold by
Coley Kristine
Bought by
Watson Carolyn and Watson Michael
Purchase Details
Closed on
Sep 29, 2008
Sold by
Coley Kristine and Coley Shane
Bought by
Coley Kristine
Purchase Details
Closed on
Jul 2, 2007
Sold by
Lewis Jennifer C and Lewis Jennifer G
Bought by
Coley Kristine and Coley Shane
Purchase Details
Closed on
Nov 19, 1999
Sold by
Norton Nicholas S and Norton Elizabeth G
Bought by
Lewis John C and Lewis Jennifer C
Purchase Details
Closed on
Jul 29, 1994
Sold by
Mcoscar Diane L
Bought by
Norton Nicholas S and Norton Elizabeth G
Purchase Details
Closed on
Jul 24, 1992
Sold by
Donilon Kerry A
Bought by
Mcoscar Diane L
Purchase Details
Closed on
Mar 29, 1991
Sold by
Mackinnon John S
Bought by
Donilon Kerry A
Purchase Details
Closed on
Nov 23, 1988
Sold by
Daly John H
Bought by
Mackinnon John S
Create a Home Valuation Report for This Property
The Home Valuation Report is an in-depth analysis detailing your home's value as well as a comparison with similar homes in the area
Home Values in the Area
Average Home Value in this Area
Purchase History
| Date | Buyer | Sale Price | Title Company |
|---|---|---|---|
| South Street Lot 5 Llc | $1,065,000 | None Available | |
| South Street Lot 5 Llc | $1,065,000 | None Available | |
| Watson Carolyn | $695,000 | -- | |
| Watson Carolyn | $695,000 | -- | |
| Coley Kristine | -- | -- | |
| Coley Kristine | -- | -- | |
| Coley Kristine | $720,000 | -- | |
| Coley Kristine | $720,000 | -- | |
| Lewis John C | $410,000 | -- | |
| Norton Nicholas S | $313,000 | -- | |
| Norton Nicholas S | $313,000 | -- | |
| Mcoscar Diane L | $240,000 | -- | |
| Mcoscar Diane L | $240,000 | -- | |
| Donilon Kerry A | $205,000 | -- | |
| Donilon Kerry A | $205,000 | -- | |
| Mackinnon John S | $182,000 | -- |
Source: Public Records
Mortgage History
| Date | Status | Borrower | Loan Amount |
|---|---|---|---|
| Open | South Street Lot 5 Llc | $2,112,000 | |
| Closed | South Street Lot 5 Llc | $2,112,000 | |
| Previous Owner | Mackinnon John S | $455,000 |
Source: Public Records
Tax History
| Year | Tax Paid | Tax Assessment Tax Assessment Total Assessment is a certain percentage of the fair market value that is determined by local assessors to be the total taxable value of land and additions on the property. | Land | Improvement |
|---|---|---|---|---|
| 2025 | $15,369 | $1,495,000 | $890,000 | $605,000 |
| 2024 | $14,501 | $1,393,000 | $809,000 | $584,000 |
| 2023 | $15,034 | $1,313,000 | $757,000 | $556,000 |
| 2022 | $14,028 | $1,201,000 | $650,000 | $551,000 |
| 2021 | $13,771 | $1,172,000 | $621,000 | $551,000 |
| 2020 | $13,548 | $1,172,000 | $621,000 | $551,000 |
| 2019 | $13,236 | $1,144,000 | $593,000 | $551,000 |
| 2018 | $13,814 | $1,156,000 | $589,000 | $567,000 |
| 2017 | $13,629 | $1,156,000 | $589,000 | $567,000 |
| 2016 | $13,463 | $1,138,000 | $579,000 | $559,000 |
| 2015 | $8,589 | $743,000 | $522,000 | $221,000 |
Source: Public Records
Map
Nearby Homes
- 148 Weston Rd Unit 208
- 40 Pinewood Rd
- 26B Pleasant St Unit B
- 34 Pleasant St Unit 5
- 63 Oak St Unit B
- 29 Pinewood Rd
- 63 Linden St Unit 1
- 63 Linden St Unit 6
- 100 Linden St Unit 111
- 48 Patton Rd
- 25 Mansfield Rd
- 16 Stearns Rd Unit 101
- 16 Stearns Rd Unit 106
- 16 Stearns Rd Unit 103
- 16 Stearns Rd Unit 304
- 16 Stearns Rd Unit 104
- 5 Abbott St
- 78 Denton Rd
- 18 Sprague Rd
- 201 Lowell Rd
Your Personal Tour Guide
Ask me questions while you tour the home.