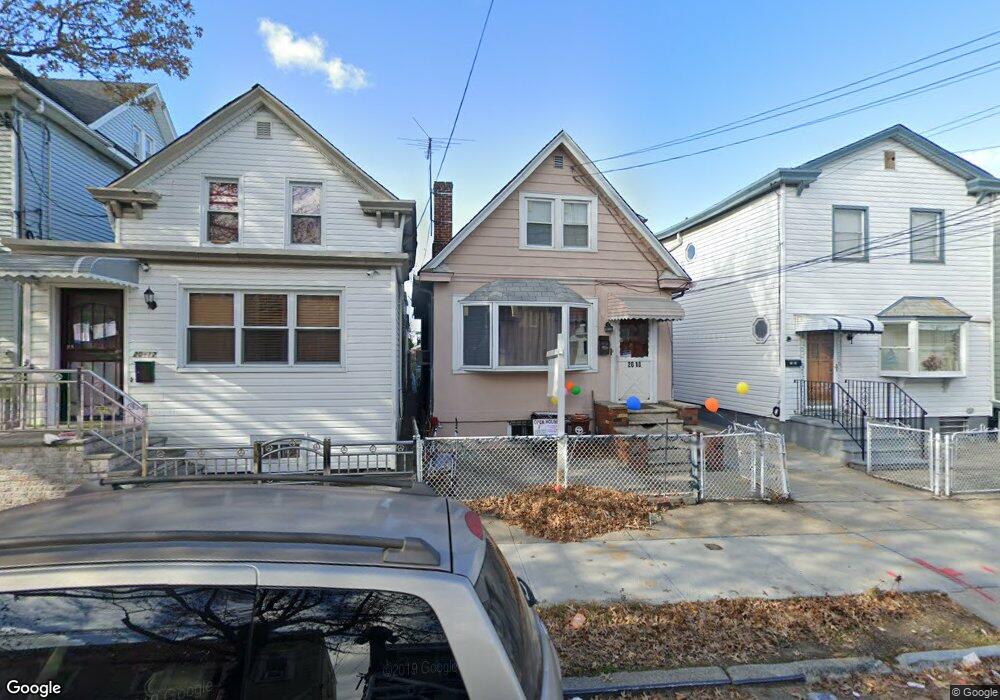
2010 126th St College Point, NY 11356
College Point NeighborhoodEstimated Value: $760,557 - $970,000
4
Beds
3
Baths
945
Sq Ft
$900/Sq Ft
Est. Value
About This Home
This home is located at 2010 126th St, College Point, NY 11356 and is currently estimated at $850,889, approximately $900 per square foot. 2010 126th St is a home located in Queens County with nearby schools including P.S. 29, Jhs 185 Edward Bleeker, and Flushing High School.
Ownership History
Date
Name
Owned For
Owner Type
Purchase Details
Closed on
Apr 24, 2018
Sold by
Maryum Siddiqy Maryum A and Maryum Tambra
Bought by
Great888realty Llc
Current Estimated Value
Purchase Details
Closed on
Feb 16, 2006
Sold by
Hashmi
Bought by
Siddiqy Maryum A
Home Financials for this Owner
Home Financials are based on the most recent Mortgage that was taken out on this home.
Original Mortgage
$289,500
Interest Rate
6.16%
Mortgage Type
Purchase Money Mortgage
Purchase Details
Closed on
Jul 13, 1999
Sold by
Suleman Tambra Afshan and Suleman Arif
Bought by
Afshan Tambra Usman M and Afshan Tambra
Purchase Details
Closed on
Jul 2, 1998
Sold by
Voight Richard and Dobler Fred R
Bought by
Tambra Afshan U and Hashmi Afshan
Home Financials for this Owner
Home Financials are based on the most recent Mortgage that was taken out on this home.
Original Mortgage
$106,400
Interest Rate
8.5%
Create a Home Valuation Report for This Property
The Home Valuation Report is an in-depth analysis detailing your home's value as well as a comparison with similar homes in the area
Home Values in the Area
Average Home Value in this Area
Purchase History
| Date | Buyer | Sale Price | Title Company |
|---|---|---|---|
| Great888realty Llc | $570,000 | -- | |
| Siddiqy Maryum A | $430,000 | -- | |
| Afshan Tambra Usman M | -- | Lawyers Title Insurance Corp | |
| Tambra Afshan U | $133,000 | Ticor Title Guarantee Compan |
Source: Public Records
Mortgage History
| Date | Status | Borrower | Loan Amount |
|---|---|---|---|
| Previous Owner | Siddiqy Maryum A | $289,500 | |
| Previous Owner | Tambra Afshan U | $106,400 |
Source: Public Records
Tax History Compared to Growth
Tax History
| Year | Tax Paid | Tax Assessment Tax Assessment Total Assessment is a certain percentage of the fair market value that is determined by local assessors to be the total taxable value of land and additions on the property. | Land | Improvement |
|---|---|---|---|---|
| 2025 | $5,555 | $29,317 | $6,108 | $23,209 |
| 2024 | $5,555 | $27,658 | $5,812 | $21,846 |
| 2023 | $5,241 | $26,093 | $4,952 | $21,141 |
| 2022 | $3,855 | $48,180 | $8,700 | $39,480 |
| 2021 | $5,418 | $40,680 | $8,700 | $31,980 |
| 2020 | $5,073 | $41,340 | $8,700 | $32,640 |
| 2019 | $4,821 | $39,240 | $8,700 | $30,540 |
| 2018 | $4,432 | $21,744 | $4,636 | $17,108 |
| 2017 | $4,374 | $21,456 | $5,237 | $16,219 |
| 2016 | $4,289 | $21,456 | $5,237 | $16,219 |
| 2015 | $2,441 | $20,359 | $6,990 | $13,369 |
| 2014 | $2,441 | $19,207 | $7,906 | $11,301 |
Source: Public Records
Map
Nearby Homes
- 18-43 124th St
- 22-03 125th St
- 2201 125th St
- 1830 124th St
- 2220 126th St
- 2105 123rd St
- 123-09 20th Ave
- 125-15 18th Ave
- 124-17 18th Ave
- 18-11 123rd St Unit 4F
- 20-11 College Point Blvd
- 22-40 125th St
- 18-14 129th St
- 18-29 129th St
- 2232 124th St
- 126-01 23rd Ave
- 1521 124th St
- 20-22 College Point Blvd
- 15-09 127th St
- 2045 121st St
- 2010 126th St
- 2010 126th St
- 2010 126th St
- 2010 126th St
- 2012 126th St
- 2012 126th St Unit 2
- 2012 126th St
- 2006 126th St
- 20-14 126th St Unit 2Fl
- 2014 126th St Unit 2Fl
- 2014 126th St
- 2004 126th St
- 2018 126th St
- 20-18 126th St
- 12512 20th Ave
- 2002 126th St
- 20-20 126th St
- 2020 126th St
- 2020 126th St
- 20-04 126th St