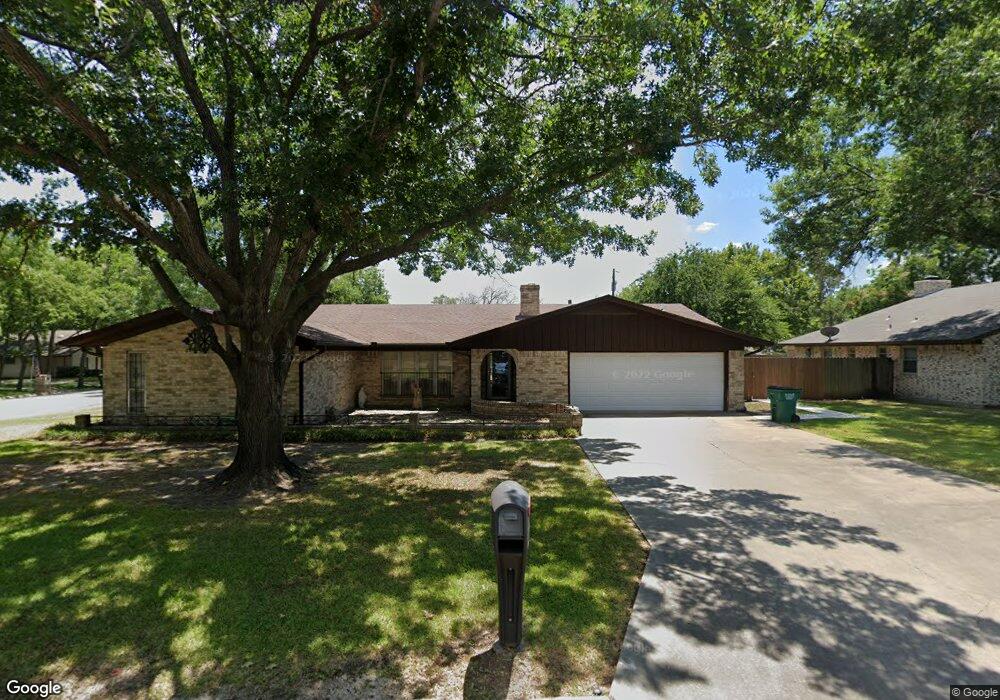
2010 Brentwood St Gainesville, TX 76240
Estimated Value: $295,000 - $365,000
3
Beds
2
Baths
2,417
Sq Ft
$138/Sq Ft
Est. Value
About This Home
This home is located at 2010 Brentwood St, Gainesville, TX 76240 and is currently estimated at $333,809, approximately $138 per square foot. 2010 Brentwood St is a home located in Cooke County with nearby schools including Edison Elementary School, W.E. Chalmers Elementary School, and Gainesville Intermediate School.
Ownership History
Date
Name
Owned For
Owner Type
Purchase Details
Closed on
Sep 11, 2008
Sold by
Preston Steven C
Bought by
Klement James
Current Estimated Value
Home Financials for this Owner
Home Financials are based on the most recent Mortgage that was taken out on this home.
Original Mortgage
$53,505
Interest Rate
6.54%
Mortgage Type
Purchase Money Mortgage
Purchase Details
Closed on
Mar 26, 2008
Sold by
Jackson Alphonso
Bought by
Klement James
Home Financials for this Owner
Home Financials are based on the most recent Mortgage that was taken out on this home.
Original Mortgage
$34,676
Interest Rate
5.72%
Mortgage Type
Purchase Money Mortgage
Purchase Details
Closed on
Aug 3, 2007
Sold by
Jackson Alphonso
Bought by
Klement James
Home Financials for this Owner
Home Financials are based on the most recent Mortgage that was taken out on this home.
Original Mortgage
$52,000
Interest Rate
6.73%
Mortgage Type
Purchase Money Mortgage
Create a Home Valuation Report for This Property
The Home Valuation Report is an in-depth analysis detailing your home's value as well as a comparison with similar homes in the area
Home Values in the Area
Average Home Value in this Area
Purchase History
| Date | Buyer | Sale Price | Title Company |
|---|---|---|---|
| Klement James | -- | -- | |
| Klement James | -- | -- | |
| Klement James | -- | -- |
Source: Public Records
Mortgage History
| Date | Status | Borrower | Loan Amount |
|---|---|---|---|
| Closed | Klement James | $53,505 | |
| Previous Owner | Klement James | $34,676 | |
| Previous Owner | Klement James | $52,000 |
Source: Public Records
Tax History Compared to Growth
Tax History
| Year | Tax Paid | Tax Assessment Tax Assessment Total Assessment is a certain percentage of the fair market value that is determined by local assessors to be the total taxable value of land and additions on the property. | Land | Improvement |
|---|---|---|---|---|
| 2025 | $2,121 | $371,852 | $55,444 | $317,016 |
| 2024 | $2,121 | $372,452 | $55,436 | $317,016 |
| 2023 | $6,029 | $307,315 | $55,436 | $305,315 |
| 2022 | $6,082 | $327,982 | $50,421 | $277,561 |
| 2021 | $6,540 | $255,850 | $30,497 | $225,353 |
| 2020 | $6,132 | $231,868 | $29,141 | $202,727 |
| 2019 | $5,736 | $211,613 | $29,141 | $182,472 |
| 2018 | $5,207 | $190,818 | $24,939 | $165,879 |
| 2017 | $4,889 | $179,829 | $21,686 | $158,143 |
| 2015 | $3,184 | $170,972 | $21,686 | $149,286 |
| 2014 | $3,184 | $169,756 | $21,686 | $148,070 |
Source: Public Records
Map
Nearby Homes
- 1010 Aspen Rd
- 2002 Everglade Dr
- 1907 Woodlawn Ct
- 904 Wheeler Creek Dr
- 00 O'Neal St
- 1112 Hillside Dr
- 1109 Elmwood St
- 2005 Maplewood Dr
- 1212 Aspen Rd
- 2003 Cypress St
- 417 Willow Way
- 1102 Fair Ave
- 418 Hillside Dr
- 1113 Fair Ave
- 1520 Olive St
- 705 Fair Ave
- 1016 N Howeth St
- 311 Wheeler Creek Ct
- 1305 Hillcrest Blvd
- 811 Ritchey St
- 2008 Brentwood St
- 1004 Aspen Rd
- 1002 Aspen Rd
- 2011 Brentwood St
- 2006 Brentwood St
- 2009 Brentwood St
- 2007 Woodlawn St
- 1000 Aspen Rd
- 2007 Brentwood St
- 2004 Brentwood St
- 2005 Woodlawn St
- 904 Aspen Rd
- 2012 Oneal St
- 2014 Woodlawn St
- 2005 Brentwood St
- 2012 Woodlawn St
- 1001 Wheeler Creek Dr
- 1003 Wheeler Creek Dr
- 2008 Woodlawn St
- 915 Wheeler Creek Dr