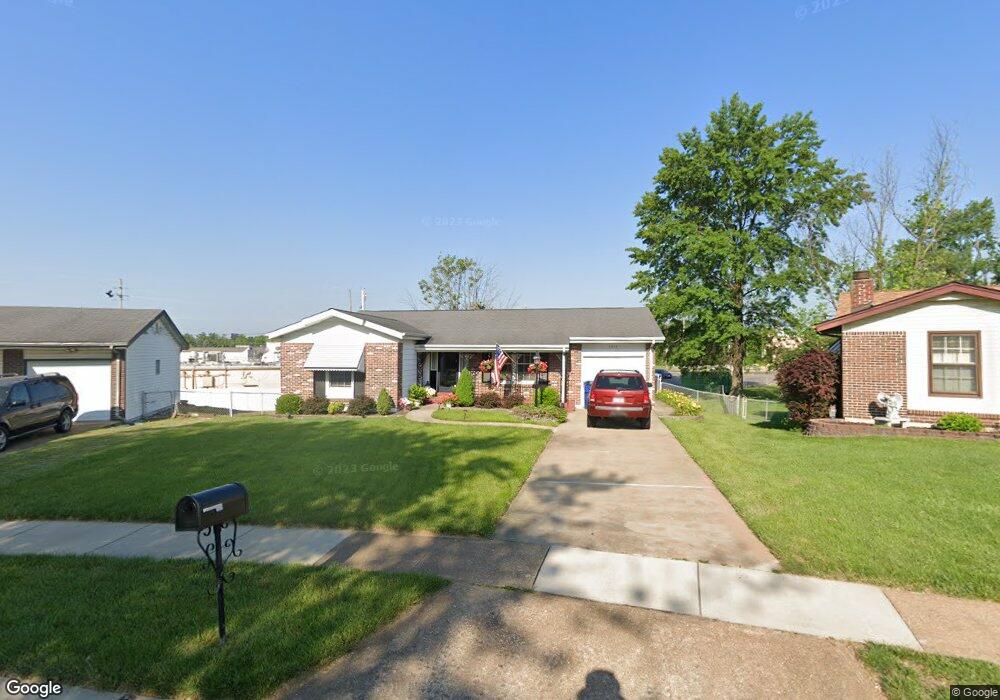
2010 Brutus Ct Fenton, MO 63026
Estimated Value: $178,000 - $264,000
3
Beds
2
Baths
1,101
Sq Ft
$206/Sq Ft
Est. Value
About This Home
This home is located at 2010 Brutus Ct, Fenton, MO 63026 and is currently estimated at $226,415, approximately $205 per square foot. 2010 Brutus Ct is a home located in St. Louis County with nearby schools including Uthoff Valley Elementary School, Rockwood South Middle School, and Rockwood Summit Senior High School.
Ownership History
Date
Name
Owned For
Owner Type
Purchase Details
Closed on
Jun 1, 2022
Sold by
Florence A Gunter Revocable Trust and Gunter Florence A
Bought by
Gunter Antoinette
Current Estimated Value
Home Financials for this Owner
Home Financials are based on the most recent Mortgage that was taken out on this home.
Original Mortgage
$97,500
Outstanding Balance
$92,633
Interest Rate
5.1%
Mortgage Type
New Conventional
Estimated Equity
$133,782
Purchase Details
Closed on
Dec 5, 2016
Sold by
Gunter Florence A
Bought by
Gunter Florence A and Florence A Gunter Revocable Trust
Purchase Details
Closed on
Oct 20, 2016
Sold by
Gunter Larry G and Gunter Antionette
Bought by
Gunter Florence A
Purchase Details
Closed on
Dec 11, 2015
Sold by
Gunter Larry G
Bought by
Gunter Florence A and Gunter Larry G
Purchase Details
Closed on
May 19, 2015
Sold by
Gunter Florence A
Bought by
Gunter Larry G
Create a Home Valuation Report for This Property
The Home Valuation Report is an in-depth analysis detailing your home's value as well as a comparison with similar homes in the area
Home Values in the Area
Average Home Value in this Area
Purchase History
| Date | Buyer | Sale Price | Title Company |
|---|---|---|---|
| Gunter Antoinette | $130,000 | Servicelink | |
| Gunter Florence A | -- | None Available | |
| Gunter Florence A | -- | None Available | |
| Gunter Florence A | -- | None Available | |
| Gunter Larry G | -- | None Available |
Source: Public Records
Mortgage History
| Date | Status | Borrower | Loan Amount |
|---|---|---|---|
| Open | Gunter Antoinette | $97,500 |
Source: Public Records
Tax History Compared to Growth
Tax History
| Year | Tax Paid | Tax Assessment Tax Assessment Total Assessment is a certain percentage of the fair market value that is determined by local assessors to be the total taxable value of land and additions on the property. | Land | Improvement |
|---|---|---|---|---|
| 2025 | $3,166 | $48,850 | $23,710 | $25,140 |
| 2024 | $3,166 | $42,370 | $18,600 | $23,770 |
| 2023 | $3,163 | $42,370 | $18,600 | $23,770 |
| 2022 | $3,078 | $38,420 | $16,530 | $21,890 |
| 2021 | $3,055 | $38,420 | $16,530 | $21,890 |
| 2020 | $2,877 | $34,770 | $17,590 | $17,180 |
| 2019 | $2,885 | $34,770 | $17,590 | $17,180 |
| 2018 | $2,801 | $32,380 | $13,720 | $18,660 |
| 2017 | $2,779 | $32,380 | $13,720 | $18,660 |
| 2016 | $2,363 | $27,760 | $9,920 | $17,840 |
| 2015 | $2,314 | $27,760 | $9,920 | $17,840 |
| 2014 | -- | $24,770 | $7,140 | $17,630 |
Source: Public Records
Map
Nearby Homes
- 2017 Brutus Ct
- 1655 Valley Park Rd
- 161 Majestic Dr
- 107 Majestic Dr
- 2 Salvation Ridge Ct
- 1823 Dover Trace Dr
- 1923 Smizer Mill Rd
- 1808 Dover Trace Dr
- 1719 Chestnut Farms Ct
- 1800 Harbor Mill Dr
- 1851 Hawkins Place
- 1818 Charles Thomas Ln
- 1107 Coronita Way
- 386 Westwind Estates Ln
- 1881 San Pedro Ln
- 425 Benton St
- 1883 San Lucas Ln
- 1575 Uthoff Dr
- 627 Benton St
- 478 Xavier Ct
- 2008 Brutus Ct
- 2012 Brutus Ct
- 2006 Brutus Ct
- 1600 Valley Park Rd
- 2014 Brutus Ct
- 1602 Valley Park Rd
- 2011 Brutus Ct
- 2004 Brutus Ct
- 2016 Brutus Ct
- 1604 Valley Park Rd
- 2013 Brutus Ct
- 2009 Brutus Ct
- 1606 Valley Park Rd
- 2018 Brutus Ct
- 2012 Novem Dr
- 2002 Brutus Ct
- 2015 Brutus Ct
- 3 Valley Park Rd Unit C
- 3 Valley Park Rd
- 1608 Valley Park Rd