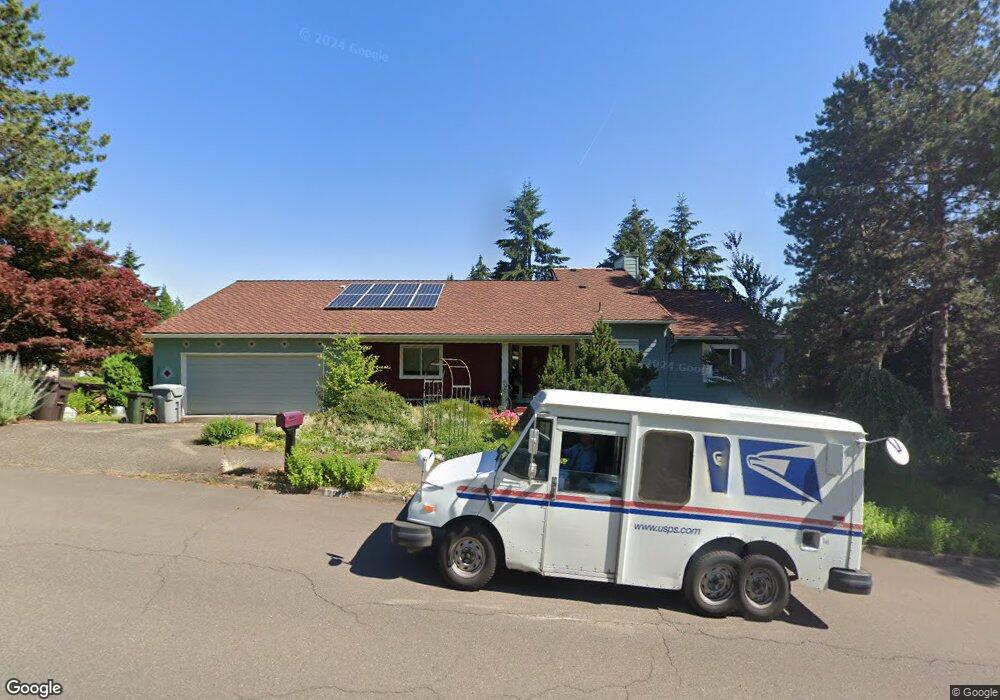
2010 Carriage Way West Linn, OR 97068
Hidden Springs NeighborhoodEstimated Value: $815,164 - $938,000
3
Beds
3
Baths
2,903
Sq Ft
$297/Sq Ft
Est. Value
About This Home
This home is located at 2010 Carriage Way, West Linn, OR 97068 and is currently estimated at $860,791, approximately $296 per square foot. 2010 Carriage Way is a home located in Clackamas County with nearby schools including Stafford Primary School, West Linn High School, and Harmony Academy.
Ownership History
Date
Name
Owned For
Owner Type
Purchase Details
Closed on
Apr 16, 2003
Sold by
Jackley John and Courtney Susan T L
Bought by
Milner Mary
Current Estimated Value
Home Financials for this Owner
Home Financials are based on the most recent Mortgage that was taken out on this home.
Original Mortgage
$217,500
Outstanding Balance
$88,301
Interest Rate
5.12%
Estimated Equity
$772,490
Purchase Details
Closed on
Aug 7, 1998
Sold by
Jackley Joanne P
Bought by
Jackley John
Purchase Details
Closed on
Sep 25, 1997
Sold by
Courson Violet R
Bought by
Palmer Robert J
Purchase Details
Closed on
Apr 5, 1996
Sold by
Jackley Lawrence Winfield
Bought by
Jackley Joanne P
Purchase Details
Closed on
Jul 6, 1995
Sold by
Beam Richard R and Beam Kristine S
Bought by
Jackley Lawrence Winfield
Create a Home Valuation Report for This Property
The Home Valuation Report is an in-depth analysis detailing your home's value as well as a comparison with similar homes in the area
Home Values in the Area
Average Home Value in this Area
Purchase History
| Date | Buyer | Sale Price | Title Company |
|---|---|---|---|
| Milner Mary | $290,000 | First Amer Title Ins Co Of O | |
| Jackley John | -- | -- | |
| Palmer Robert J | -- | -- | |
| Jackley Joanne P | $205,000 | Fidelity National Title Co | |
| Jackley Lawrence Winfield | $200,000 | Fidelity National Title Co |
Source: Public Records
Mortgage History
| Date | Status | Borrower | Loan Amount |
|---|---|---|---|
| Open | Milner Mary | $217,500 |
Source: Public Records
Tax History Compared to Growth
Tax History
| Year | Tax Paid | Tax Assessment Tax Assessment Total Assessment is a certain percentage of the fair market value that is determined by local assessors to be the total taxable value of land and additions on the property. | Land | Improvement |
|---|---|---|---|---|
| 2025 | $8,701 | $451,481 | -- | -- |
| 2024 | $8,375 | $438,332 | -- | -- |
| 2023 | $8,375 | $425,566 | $0 | $0 |
| 2022 | $7,905 | $413,171 | $0 | $0 |
| 2021 | $7,504 | $401,137 | $0 | $0 |
| 2020 | $7,555 | $389,454 | $0 | $0 |
| 2019 | $7,205 | $378,111 | $0 | $0 |
| 2018 | $6,883 | $367,098 | $0 | $0 |
| 2017 | $6,485 | $353,842 | $0 | $0 |
| 2016 | $5,969 | $328,941 | $0 | $0 |
| 2015 | $5,694 | $319,360 | $0 | $0 |
| 2014 | $5,385 | $310,058 | $0 | $0 |
Source: Public Records
Map
Nearby Homes
- 2005 Carriage Way
- 19686 Sun Cir
- 19655 Sun Cir
- 19661 Sun Cir
- 2090 Valley View Dr
- 19775 Wildwood Dr
- 19770 Wildwood Dr
- 2086 Sunray Cir
- 19640 Kapteyns St
- 2038 Titan Terrace
- 19788 Wildwood Dr
- 19874 Bennington Ct
- 6233 Meridian Cir
- 3029 Club House Ct
- 3088 Club House Ct
- 800 Rosemont Rd
- 2041 Marylhurst Dr
- 6275 Clubhouse Cir
- 18711 Willamette Dr
- 6135 Cheyenne Terrace
- 19609 Sun Cir
- 19602 Wildwood Dr
- 19602
- 19619 Sun Cir
- 2035 Carriage Way (3 Bac
- 2025 Carriage Way
- 2035 Carriage Way
- 2035
- 19610 Wildwood Dr
- 19610 Wildwood Dr-Level Lt
- 19610 Wildwood Dr-Levl Lot
- 1968 Carriage Way
- 2055 Carriage Way
- 19610 Sun Cir
- 19623 Sun Cir
- 1985 Carriage Way
- 19616 Sun Cir
- 2193 Carriage Way
- 19622 Sun Cir
- 19618 Wildwood Dr