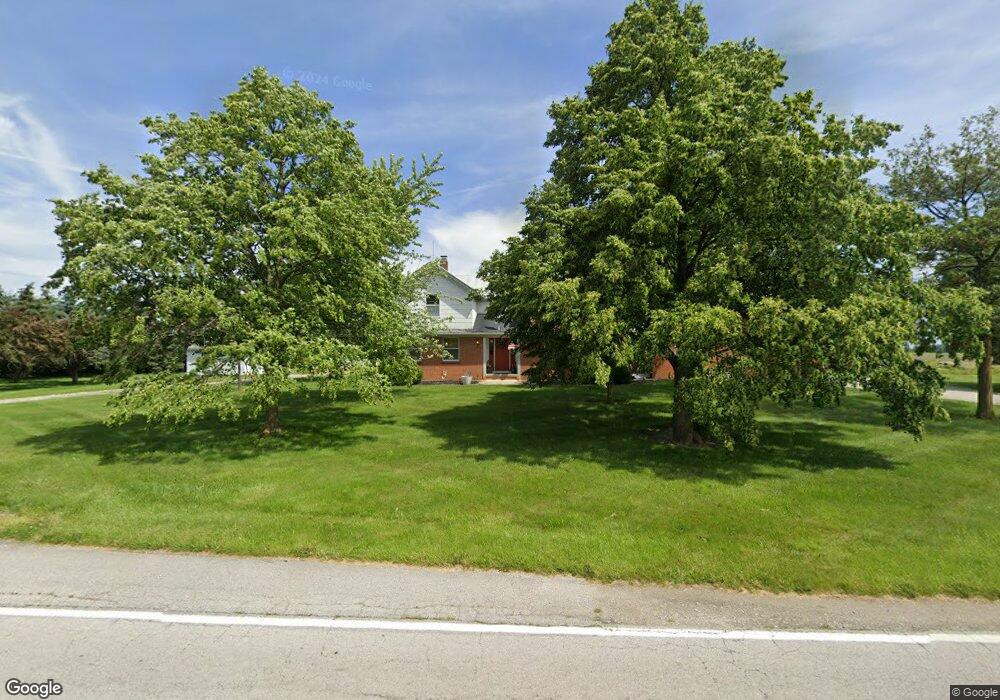
2010 County Road 39 Fremont, OH 43420
Estimated Value: $214,000 - $280,000
4
Beds
2
Baths
1,797
Sq Ft
$138/Sq Ft
Est. Value
About This Home
This home is located at 2010 County Road 39, Fremont, OH 43420 and is currently estimated at $248,078, approximately $138 per square foot. 2010 County Road 39 is a home located in Sandusky County with nearby schools including Lakota Elementary School, Lakota Middle School, and Lakota High School.
Ownership History
Date
Name
Owned For
Owner Type
Purchase Details
Closed on
Apr 11, 2017
Sold by
Bruns Erika A and Haeusser Erika A
Bought by
Bruns Chad W
Current Estimated Value
Purchase Details
Closed on
Jul 31, 2009
Sold by
Burmeister John F
Bought by
Bruns Chad W and Bruns Erika A
Home Financials for this Owner
Home Financials are based on the most recent Mortgage that was taken out on this home.
Original Mortgage
$96,000
Outstanding Balance
$63,291
Interest Rate
5.43%
Mortgage Type
New Conventional
Estimated Equity
$184,787
Purchase Details
Closed on
Jul 28, 2009
Sold by
Burmeister John F
Bought by
Burmeister David I and Burmeister Sandra D
Home Financials for this Owner
Home Financials are based on the most recent Mortgage that was taken out on this home.
Original Mortgage
$96,000
Outstanding Balance
$63,291
Interest Rate
5.43%
Mortgage Type
New Conventional
Estimated Equity
$184,787
Purchase Details
Closed on
Dec 1, 1992
Bought by
Bruns Chad W and Bruns Erika A
Create a Home Valuation Report for This Property
The Home Valuation Report is an in-depth analysis detailing your home's value as well as a comparison with similar homes in the area
Home Values in the Area
Average Home Value in this Area
Purchase History
| Date | Buyer | Sale Price | Title Company |
|---|---|---|---|
| Bruns Chad W | -- | Attorney | |
| Bruns Chad W | $120,000 | Attorney | |
| Burmeister David I | $146,300 | First American | |
| Bruns Chad W | -- | -- |
Source: Public Records
Mortgage History
| Date | Status | Borrower | Loan Amount |
|---|---|---|---|
| Open | Bruns Chad W | $96,000 |
Source: Public Records
Tax History Compared to Growth
Tax History
| Year | Tax Paid | Tax Assessment Tax Assessment Total Assessment is a certain percentage of the fair market value that is determined by local assessors to be the total taxable value of land and additions on the property. | Land | Improvement |
|---|---|---|---|---|
| 2024 | $1,993 | $57,300 | $22,750 | $34,550 |
| 2023 | $1,993 | $48,760 | $17,120 | $31,640 |
| 2022 | $2,063 | $48,760 | $17,120 | $31,640 |
| 2021 | $1,814 | $48,760 | $17,120 | $31,640 |
| 2020 | $1,814 | $44,380 | $15,540 | $28,840 |
| 2019 | $1,797 | $44,380 | $15,540 | $28,840 |
| 2018 | $1,830 | $44,380 | $15,540 | $28,840 |
| 2017 | $1,656 | $41,550 | $15,540 | $26,010 |
| 2016 | $1,542 | $41,550 | $15,540 | $26,010 |
| 2015 | $1,617 | $41,550 | $15,540 | $26,010 |
| 2014 | $1,555 | $38,820 | $12,640 | $26,180 |
| 2013 | $1,525 | $38,820 | $12,640 | $26,180 |
Source: Public Records
Map
Nearby Homes
- 2231 County Road 23
- 17 Adams Dr
- 704 County Road 126
- 855 Rambo Ln
- 0 State Route 590 Unit 6136844
- 2595 County Road 13
- 2484 Buckland Ave
- 0 Ohio 590
- 43 Sun Valley Dr Unit 43
- 1719 Buckland Ave
- 0 County Road 59
- 614 3rd Ave
- 10 Meadowbrook Dr
- 10 Meadowbrook Ln
- 880 Cleveland Ave
- 1485 Autumn Woods Dr
- 64 River Run Dr Unit J
- 64 River Run Dr
- 41 Brookview Dr
- 350 Conner Dr
- 1258 County Road 100
- 1864 County Road 39
- 1278 County Road 12
- 1220 County Road 12
- 1323 County Road 12
- 1307 County Road 12
- 1269 County Road 12
- 1405 County Road 12
- 1800 Cr 39
- 1800 County Road 39
- 1138 County Road 12
- 1795 County Road 39
- 1187 County Road 12
- 1209 County Road 12
- 1097 County Road 100
- 1538 County Road 100
- 1750 County Road 39
- 1364 County Road 116
- 1416 County Road 116
- 1046 County Road 100