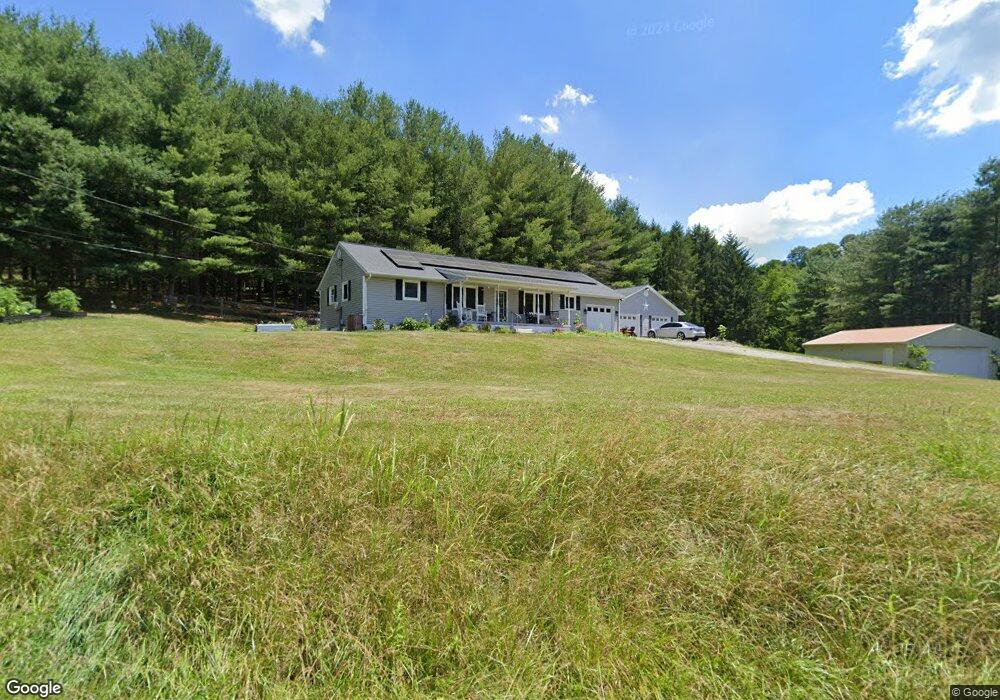
2010 Debord Rd Chillicothe, OH 45601
Estimated Value: $228,295 - $438,000
5
Beds
3
Baths
2,430
Sq Ft
$132/Sq Ft
Est. Value
About This Home
This home is located at 2010 Debord Rd, Chillicothe, OH 45601 and is currently estimated at $319,824, approximately $131 per square foot. 2010 Debord Rd is a home located in Ross County with nearby schools including Huntington Elementary School, Huntington Middle School, and Huntington High School.
Ownership History
Date
Name
Owned For
Owner Type
Purchase Details
Closed on
Jan 14, 2021
Sold by
Dewyer Cody S
Bought by
Stockham Glen P and Stockham Jennifer D
Current Estimated Value
Home Financials for this Owner
Home Financials are based on the most recent Mortgage that was taken out on this home.
Original Mortgage
$314,061
Outstanding Balance
$280,301
Interest Rate
2.71%
Mortgage Type
VA
Estimated Equity
$39,523
Purchase Details
Closed on
Jan 17, 2019
Sold by
Dowyer Cody S and Dowyer Lynn
Bought by
Dewyer Cody S
Home Financials for this Owner
Home Financials are based on the most recent Mortgage that was taken out on this home.
Original Mortgage
$201,435
Interest Rate
4.6%
Mortgage Type
VA
Purchase Details
Closed on
Aug 11, 2012
Sold by
Moore Dennis H and Moore Theresa A
Bought by
Dewyer Cody S
Home Financials for this Owner
Home Financials are based on the most recent Mortgage that was taken out on this home.
Original Mortgage
$168,547
Interest Rate
3.6%
Mortgage Type
VA
Create a Home Valuation Report for This Property
The Home Valuation Report is an in-depth analysis detailing your home's value as well as a comparison with similar homes in the area
Home Values in the Area
Average Home Value in this Area
Purchase History
| Date | Buyer | Sale Price | Title Company |
|---|---|---|---|
| Stockham Glen P | $307,000 | First Ohio Ttl Ins Agcy Ltd | |
| Dewyer Cody S | -- | None Available | |
| Dewyer Cody S | $165,000 | Arrow Title Agency Llc |
Source: Public Records
Mortgage History
| Date | Status | Borrower | Loan Amount |
|---|---|---|---|
| Open | Stockham Glen P | $314,061 | |
| Closed | Dewyer Cody S | $201,435 | |
| Closed | Dewyer Cody S | $168,547 |
Source: Public Records
Tax History Compared to Growth
Tax History
| Year | Tax Paid | Tax Assessment Tax Assessment Total Assessment is a certain percentage of the fair market value that is determined by local assessors to be the total taxable value of land and additions on the property. | Land | Improvement |
|---|---|---|---|---|
| 2024 | $1,843 | $51,120 | $4,880 | $46,240 |
| 2023 | $1,843 | $51,120 | $4,880 | $46,240 |
| 2022 | $1,860 | $51,120 | $4,880 | $46,240 |
| 2021 | $1,372 | $35,680 | $3,440 | $32,240 |
| 2020 | $1,369 | $35,680 | $3,440 | $32,240 |
| 2019 | $1,402 | $35,680 | $3,440 | $32,240 |
| 2018 | $1,277 | $31,690 | $3,340 | $28,350 |
| 2017 | $1,283 | $31,690 | $3,340 | $28,350 |
| 2016 | $1,253 | $31,690 | $3,340 | $28,350 |
| 2015 | $1,305 | $33,380 | $3,340 | $30,040 |
| 2014 | $1,224 | $33,380 | $3,340 | $30,040 |
| 2013 | $1,230 | $33,380 | $3,340 | $30,040 |
Source: Public Records
Map
Nearby Homes
- 1588 Debord Rd
- 1824 Debord Rd
- 1456 Debord Rd
- 1886 Blain Hwy
- 3857 Us Highway 23
- 935 Keiser Rd
- 300 Woods Hollow Rd
- 1799 Woods Hollow Rd
- 2295 Keiser Rd
- 4001 Prussia Rd
- 0 Pennington Rd Unit 198207
- 361 Gee Hollow Rd
- 571 Alma Omega Rd
- 5171 Denver Rd
- 0 Beatty Rd
- 3101 Mount Tabor Rd
- 1048 Beatty Rd
- 5690 Blain Hwy
- 2220 Denver Rd
- 182 Gullion Ln
- 1928 Debord Rd
- 1969 Debord Rd
- 1969 Debord Rd
- 2136 Debord Rd
- 464 Debord Rd Unit Lot16
- 464 Debord Rd Unit Lot15
- 10.94 Ac Debord Rd
- 0 Debord Rd
- Lot 2 Debord Rd
- Lot 1 Debord Rd
- Lot # 3 Debord Rd
- Lot # 4 Debord Rd
- Lot 17 Debord Rd
- Lot # 16 Debord Rd
- 420 Debord Rd
- Lot #9 Debord Rd
- 961 Debord Rd
- LOT 11 Debord Rd
- 456 Debord Rd
- 00 Debord Rd