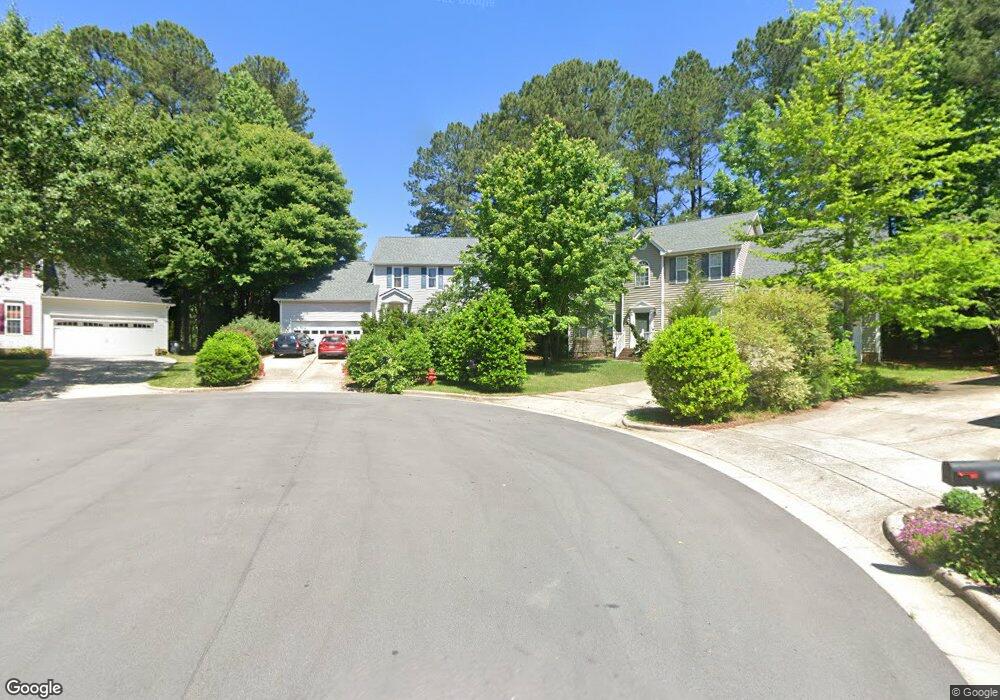
2010 Driskill Ct Apex, NC 27502
West Apex NeighborhoodEstimated Value: $459,171 - $516,000
--
Bed
3
Baths
1,641
Sq Ft
$303/Sq Ft
Est. Value
About This Home
This home is located at 2010 Driskill Ct, Apex, NC 27502 and is currently estimated at $497,293, approximately $303 per square foot. 2010 Driskill Ct is a home located in Wake County with nearby schools including Scotts Ridge Elementary School, Apex Friendship Middle School, and Apex Friendship High School.
Ownership History
Date
Name
Owned For
Owner Type
Purchase Details
Closed on
Sep 29, 2021
Sold by
Anderson Richard and Anderson Pamela J
Bought by
Anderson Richard and Anderson Pamela J
Current Estimated Value
Home Financials for this Owner
Home Financials are based on the most recent Mortgage that was taken out on this home.
Original Mortgage
$156,000
Outstanding Balance
$100,037
Interest Rate
2.8%
Mortgage Type
New Conventional
Estimated Equity
$397,256
Purchase Details
Closed on
Feb 8, 2000
Sold by
The New Fortis Corp
Bought by
Anderson Richard and Deold Pamela J
Home Financials for this Owner
Home Financials are based on the most recent Mortgage that was taken out on this home.
Original Mortgage
$118,300
Interest Rate
7.87%
Create a Home Valuation Report for This Property
The Home Valuation Report is an in-depth analysis detailing your home's value as well as a comparison with similar homes in the area
Home Values in the Area
Average Home Value in this Area
Purchase History
| Date | Buyer | Sale Price | Title Company |
|---|---|---|---|
| Anderson Richard | -- | None Available | |
| Anderson Richard | -- | None Listed On Document | |
| Anderson Richard | $158,000 | -- |
Source: Public Records
Mortgage History
| Date | Status | Borrower | Loan Amount |
|---|---|---|---|
| Open | Anderson Richard | $156,000 | |
| Closed | Anderson Richard | $156,000 | |
| Previous Owner | Anderson Richard | $118,300 | |
| Closed | Anderson Richard | $23,650 |
Source: Public Records
Tax History Compared to Growth
Tax History
| Year | Tax Paid | Tax Assessment Tax Assessment Total Assessment is a certain percentage of the fair market value that is determined by local assessors to be the total taxable value of land and additions on the property. | Land | Improvement |
|---|---|---|---|---|
| 2025 | $3,826 | $435,923 | $145,000 | $290,923 |
| 2024 | $3,741 | $435,923 | $145,000 | $290,923 |
| 2023 | $3,212 | $290,969 | $85,000 | $205,969 |
| 2022 | $3,016 | $290,969 | $85,000 | $205,969 |
| 2021 | $2,901 | $290,969 | $85,000 | $205,969 |
| 2020 | $2,871 | $290,969 | $85,000 | $205,969 |
| 2019 | $2,717 | $237,470 | $80,000 | $157,470 |
| 2018 | $2,560 | $237,470 | $80,000 | $157,470 |
| 2017 | $2,383 | $237,470 | $80,000 | $157,470 |
| 2016 | $2,348 | $237,470 | $80,000 | $157,470 |
| 2015 | $2,231 | $220,138 | $48,000 | $172,138 |
| 2014 | -- | $220,138 | $48,000 | $172,138 |
Source: Public Records
Map
Nearby Homes
- 2006 Driskill Ct
- 2108 Jerimouth Dr
- 2006 Jerimouth Dr
- 1126 Woodlands Creek Way
- 1124 Woodlands Creek Way
- 109 Kinship Ln
- 505 Brickstone Dr
- 1512 Piazzo Ct
- 312 Brierridge Dr
- 1897 Lazio Ln
- 7104 Camp Branch Ln
- 2129 Kelly Rd
- 1952 Combine Cir
- 614 Cable Ct
- 1042 Mica Lamp Ct
- 1956 Lazio Ln
- 105 Grassy Ridge Ct
- 2022 Van Hook Ln
- 2508 Whistling Quail Run
- 2805 Evans Rd
- 2009 Driskill Ct
- 2008 Driskill Ct
- 2007 Driskill Ct
- 2005 Driskill Ct
- 2004 Driskill Ct
- 2003 Driskill Ct
- 2002 Driskill Ct
- 2387 Carradonna Way
- 108 Terasina Ct
- 112 Terasina Ct
- 2102 Jerimouth Dr
- 2018 Jerimouth Dr
- 2381 Carradonna Way
- 2104 Jerimouth Dr
- 2393 Carradonna Way
- 2016 Jerimouth Dr
- 2375 Carradonna Way
- 2106 Jerimouth Dr
- 5393 Carradonna Way
- 2392 Carradonna Way