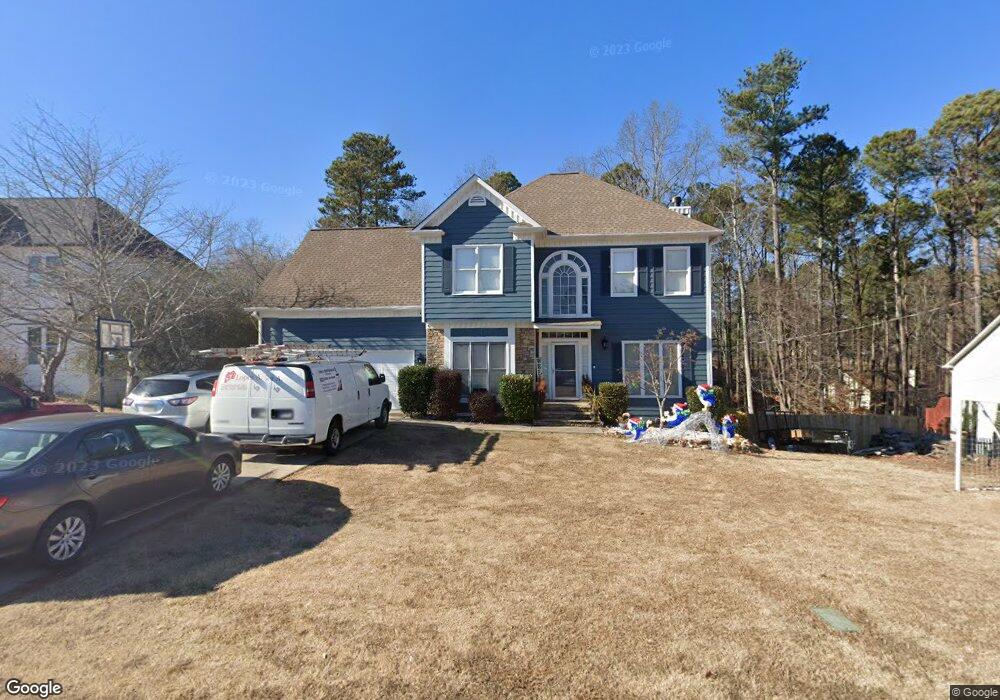
2010 Elm Tree Terrace Buford, GA 30518
Estimated Value: $436,000 - $470,000
3
Beds
3
Baths
2,156
Sq Ft
$211/Sq Ft
Est. Value
About This Home
This home is located at 2010 Elm Tree Terrace, Buford, GA 30518 and is currently estimated at $454,425, approximately $210 per square foot. 2010 Elm Tree Terrace is a home located in Gwinnett County with nearby schools including Buford Elementary School, Buford Academy, and Buford Senior Academy.
Ownership History
Date
Name
Owned For
Owner Type
Purchase Details
Closed on
Sep 14, 2020
Sold by
Linch Joseph E
Bought by
Chavez Abraham Adonias Lopez and Aranda Ana M
Current Estimated Value
Home Financials for this Owner
Home Financials are based on the most recent Mortgage that was taken out on this home.
Original Mortgage
$284,747
Outstanding Balance
$251,544
Interest Rate
2.9%
Mortgage Type
New Conventional
Estimated Equity
$202,881
Purchase Details
Closed on
Dec 10, 2004
Sold by
Huey David T and Huey Peggy
Bought by
Linch Joseph E and Linch Jennifer
Home Financials for this Owner
Home Financials are based on the most recent Mortgage that was taken out on this home.
Original Mortgage
$20,700
Interest Rate
5.57%
Purchase Details
Closed on
Oct 22, 1993
Sold by
Carroll W E
Bought by
Huey David T Peggy J
Create a Home Valuation Report for This Property
The Home Valuation Report is an in-depth analysis detailing your home's value as well as a comparison with similar homes in the area
Home Values in the Area
Average Home Value in this Area
Purchase History
| Date | Buyer | Sale Price | Title Company |
|---|---|---|---|
| Chavez Abraham Adonias Lopez | $290,000 | -- | |
| Linch Joseph E | $207,900 | -- | |
| Huey David T Peggy J | $138,000 | -- |
Source: Public Records
Mortgage History
| Date | Status | Borrower | Loan Amount |
|---|---|---|---|
| Open | Chavez Abraham Adonias Lopez | $284,747 | |
| Previous Owner | Linch Joseph E | $20,700 | |
| Previous Owner | Linch Joseph E | $166,320 | |
| Closed | Huey David T Peggy J | -- |
Source: Public Records
Tax History
| Year | Tax Paid | Tax Assessment Tax Assessment Total Assessment is a certain percentage of the fair market value that is determined by local assessors to be the total taxable value of land and additions on the property. | Land | Improvement |
|---|---|---|---|---|
| 2025 | $1,200 | $175,840 | $40,000 | $135,840 |
| 2024 | $1,200 | $110,000 | $18,000 | $92,000 |
| 2023 | $1,200 | $110,000 | $18,000 | $92,000 |
| 2022 | $1,200 | $110,000 | $18,000 | $92,000 |
| 2021 | $1,200 | $110,000 | $18,000 | $92,000 |
| 2020 | $791 | $93,400 | $18,000 | $75,400 |
| 2019 | $714 | $93,400 | $18,000 | $75,400 |
| 2018 | $714 | $93,400 | $18,000 | $75,400 |
| 2016 | $709 | $76,120 | $18,000 | $58,120 |
| 2015 | $627 | $56,800 | $10,800 | $46,000 |
| 2014 | -- | $56,800 | $10,800 | $46,000 |
Source: Public Records
Map
Nearby Homes
- 2045 Buford Dam Rd
- 5820 Elm Tree Dr Unit 1
- 1930 Marina Way
- 2075 Pine Tree Dr Unit B2
- 5774 Harbor Dr
- 5984 Dolvin Ln
- 2079 Lanier Harbor Pointe
- 5920 Branden Hill Ln
- 6265 Lake Windsor Pkwy
- 2210 Lanier Harbor Pointe
- 1920 Patrick Mill Place
- 5600 Creek Dale Way
- 5652 Leaf Ridge Ln NE
- 5652 Leaf Ridge Ln
- 5995 Lake Windsor Pkwy Unit 1
- 5648 Post Mill Ct
- 6219 Woodlake Dr
- 2125 Mina Lane Dr
- 2140 Mina Lane Dr
- 2416 Sterling Manor Dr
- 2010 Elm Tree Terrace
- 2000 Elm Tree Terrace
- 2020 Elm Tree Terrace
- 2038 Buford Dam Rd Unit 1
- 2034 Buford Dam Rd
- 1990 Elm Tree Terrace
- 2030 Elm Tree Terrace
- 2021 Elm Tree Terrace NE
- 2011 Elm Tree Terrace
- 2021 Elm Tree Terrace
- 1980 Elm Tree Terrace
- 1980 Elm Tree Terrace
- 2001 Elm Tree Terrace
- 2040 Elm Tree Terrace Unit 1
- 2041 Elm Tree Terrace
- 2026 Buford Dam Rd
- 5835 Elm Tree Dr
- 2051 Elm Tree Terrace
- 1981 Elm Tree Terrace
- 1981 Elm Tree Terrace Unit 44
Your Personal Tour Guide
Ask me questions while you tour the home.