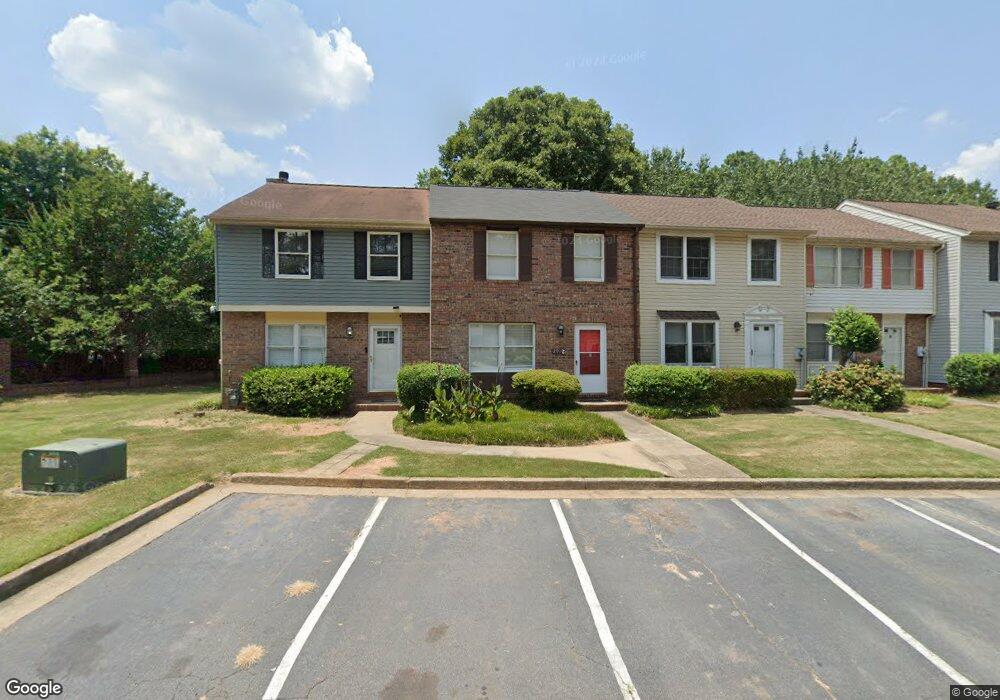
2010 Fairways Ct NW Unit 2010 Kennesaw, GA 30144
Estimated Value: $250,000 - $268,080
2
Beds
3
Baths
1,280
Sq Ft
$204/Sq Ft
Est. Value
About This Home
This home is located at 2010 Fairways Ct NW Unit 2010, Kennesaw, GA 30144 and is currently estimated at $260,770, approximately $203 per square foot. 2010 Fairways Ct NW Unit 2010 is a home located in Cobb County with nearby schools including Kennesaw Elementary School, Big Shanty Elementary School, and Palmer Middle School.
Ownership History
Date
Name
Owned For
Owner Type
Purchase Details
Closed on
Feb 27, 2024
Sold by
Cozart Drew and Cozart Mindy
Bought by
Dc Residential Ventures Llc
Current Estimated Value
Purchase Details
Closed on
Sep 14, 2023
Sold by
Williams John
Bought by
Cozart Drew and Cozart Mindy
Purchase Details
Closed on
Nov 19, 2021
Sold by
Esver Leonida D and Esver Raul H
Bought by
Williams John
Purchase Details
Closed on
Apr 28, 2008
Sold by
Wright Stuart F
Bought by
Esver Raul H and Esver Leonida D
Home Financials for this Owner
Home Financials are based on the most recent Mortgage that was taken out on this home.
Original Mortgage
$79,920
Interest Rate
5.84%
Mortgage Type
New Conventional
Purchase Details
Closed on
Jan 19, 2005
Sold by
Mcdaniel Roy J
Bought by
Wright Stuart F
Purchase Details
Closed on
Apr 30, 1998
Sold by
Miles Catherin S
Bought by
Mcdaniel Roy J
Create a Home Valuation Report for This Property
The Home Valuation Report is an in-depth analysis detailing your home's value as well as a comparison with similar homes in the area
Home Values in the Area
Average Home Value in this Area
Purchase History
| Date | Buyer | Sale Price | Title Company |
|---|---|---|---|
| Dc Residential Ventures Llc | -- | None Listed On Document | |
| Cozart Drew | $269,000 | None Listed On Document | |
| Williams John | $197,000 | Mozley Finlayson & Loggins Llp | |
| Esver Raul H | $99,900 | -- | |
| Wright Stuart F | -- | -- | |
| Mcdaniel Roy J | $74,500 | -- |
Source: Public Records
Mortgage History
| Date | Status | Borrower | Loan Amount |
|---|---|---|---|
| Previous Owner | Esver Raul H | $79,920 | |
| Closed | Mcdaniel Roy J | -- |
Source: Public Records
Tax History Compared to Growth
Tax History
| Year | Tax Paid | Tax Assessment Tax Assessment Total Assessment is a certain percentage of the fair market value that is determined by local assessors to be the total taxable value of land and additions on the property. | Land | Improvement |
|---|---|---|---|---|
| 2025 | $3,071 | $101,936 | $24,000 | $77,936 |
| 2024 | $3,073 | $101,936 | $24,000 | $77,936 |
| 2023 | $2,273 | $75,396 | $16,000 | $59,396 |
| 2022 | $2,288 | $75,396 | $16,000 | $59,396 |
| 2021 | $1,794 | $59,124 | $12,000 | $47,124 |
| 2020 | $2,105 | $52,820 | $8,000 | $44,820 |
| 2019 | $1,603 | $52,820 | $8,000 | $44,820 |
| 2018 | $1,603 | $52,820 | $8,000 | $44,820 |
| 2017 | $1,232 | $42,848 | $8,000 | $34,848 |
| 2016 | $989 | $34,408 | $9,600 | $24,808 |
| 2015 | $1,014 | $34,408 | $9,600 | $24,808 |
| 2014 | $587 | $19,748 | $0 | $0 |
Source: Public Records
Map
Nearby Homes
- 6 Fairway Dr NW
- 1050 Sand Wedge Cir NW Unit 2
- 3578 Kennesaw Station Dr NW
- 3085 Sand Wedge Cir NW
- 3709 Shiloh Trail West NW
- 1545 Kennesaw Trace Ct NW
- 1861 Grant Ct NW Unit 2
- 1871 Grant Ct NW
- 3341 Verdi Ln
- 3322 Cranston Ln
- 3771 Club Dr NW
- 3185 Country Club Ct NW
- 3711 Frey Lake Rd NW
- 1139 Shiloh Ln NW
- 3748 Creekwood Crossing NW
- 3354 Cranston Ln
- 3352 Cranston Ln
- 3350 Cranston Ln
- 1932 Appian Alley
- 1915 Cassia Alley
- 2010 Fairways Ct NW
- 2000 Fairways Ct NW
- 2020 Fairways Ct NW
- 2030 Fairways Ct NW
- 2040 Fairways Ct NW
- 2050 Fairways Ct NW
- 2060 Fairways Ct NW
- 2025 Fairways Ct NW
- 2005 Fairways Ct NW
- 2070 Fairways Ct NW
- 2015 Fairways Ct NW
- 2045 Fairways Ct NW Unit 13
- 2045 Fairways Ct NW Unit 2045
- 2045 Fairways Ct NW
- 2035 Fairways Ct NW
- 2055 Fairways Ct NW
- 2065 Fairways Ct NW
- 2065 Fairways Ct NW Unit 2065
- 2080 Fairways Ct NW
- 2075 Fairways Ct NW Unit 12C