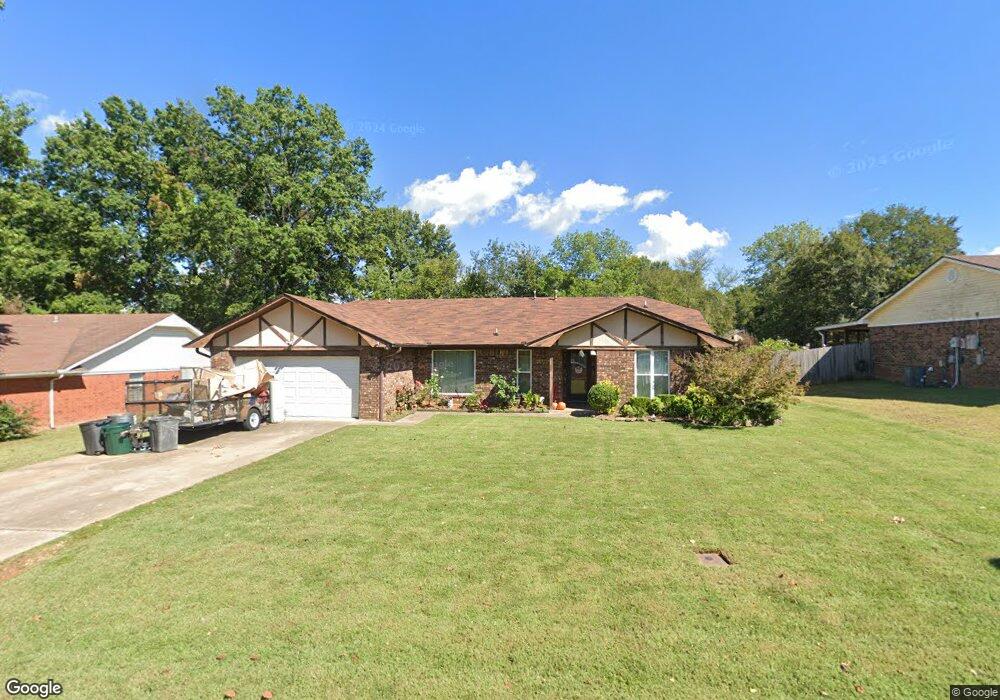
2010 Foster Branch Ln van Buren, AR 72956
Estimated Value: $209,521 - $227,000
--
Bed
2
Baths
1,668
Sq Ft
$131/Sq Ft
Est. Value
About This Home
This home is located at 2010 Foster Branch Ln, van Buren, AR 72956 and is currently estimated at $218,380, approximately $130 per square foot. 2010 Foster Branch Ln is a home located in Crawford County with nearby schools including Rena Elementary School, Northridge Middle School, and Van Buren High School.
Ownership History
Date
Name
Owned For
Owner Type
Purchase Details
Closed on
Nov 2, 2009
Sold by
Landry Ricky P and Landry Casey L
Bought by
Stewart Charles and Stewart Anjila
Current Estimated Value
Home Financials for this Owner
Home Financials are based on the most recent Mortgage that was taken out on this home.
Original Mortgage
$95,000
Outstanding Balance
$61,461
Interest Rate
4.9%
Mortgage Type
New Conventional
Estimated Equity
$156,919
Purchase Details
Closed on
Jun 16, 2006
Sold by
Stell Michael and Stell Tina
Bought by
Landry Ricky P and Landry Casey L
Home Financials for this Owner
Home Financials are based on the most recent Mortgage that was taken out on this home.
Original Mortgage
$93,600
Interest Rate
7.72%
Mortgage Type
Adjustable Rate Mortgage/ARM
Purchase Details
Closed on
Sep 5, 1997
Bought by
Mirus-Stell
Purchase Details
Closed on
May 30, 1985
Bought by
Mason-Titsworth
Purchase Details
Closed on
Jan 30, 1985
Bought by
Edwards-Mason
Create a Home Valuation Report for This Property
The Home Valuation Report is an in-depth analysis detailing your home's value as well as a comparison with similar homes in the area
Home Values in the Area
Average Home Value in this Area
Purchase History
| Date | Buyer | Sale Price | Title Company |
|---|---|---|---|
| Stewart Charles | $119,000 | -- | |
| Landry Ricky P | $116,666 | -- | |
| Mirus-Stell | $75,000 | -- | |
| Mason-Titsworth | $67,000 | -- | |
| Edwards-Mason | $10,000 | -- |
Source: Public Records
Mortgage History
| Date | Status | Borrower | Loan Amount |
|---|---|---|---|
| Open | Stewart Charles | $95,000 | |
| Previous Owner | Landry Ricky P | $93,600 |
Source: Public Records
Tax History Compared to Growth
Tax History
| Year | Tax Paid | Tax Assessment Tax Assessment Total Assessment is a certain percentage of the fair market value that is determined by local assessors to be the total taxable value of land and additions on the property. | Land | Improvement |
|---|---|---|---|---|
| 2025 | $719 | $34,260 | $3,000 | $31,260 |
| 2024 | $761 | $34,260 | $3,000 | $31,260 |
| 2023 | $779 | $34,260 | $3,000 | $31,260 |
| 2022 | $771 | $22,090 | $2,000 | $20,090 |
| 2021 | $771 | $22,090 | $2,000 | $20,090 |
| 2020 | $771 | $22,090 | $2,000 | $20,090 |
| 2019 | $771 | $22,090 | $2,000 | $20,090 |
| 2018 | $796 | $22,090 | $2,000 | $20,090 |
| 2017 | $78 | $21,840 | $2,000 | $19,840 |
| 2016 | $784 | $21,840 | $2,000 | $19,840 |
| 2015 | $718 | $21,840 | $2,000 | $19,840 |
| 2014 | $718 | $21,840 | $2,000 | $19,840 |
Source: Public Records
Map
Nearby Homes
- 2005 Broken Hill Dr
- 2016 Broken Hill Dr
- TBD Rena Rd
- 1714 River Ridge Rd
- 2203 Marble Cir
- 2205 Quartz Cir
- 1610 Amble On Ln
- 2600 Pearl Blvd
- 843 Richmond Rd
- 504 Fir Dr
- 1401 Azure Hills Dr
- 319 Copsey Dr
- 305 Boulder Dr
- 310 Copsey Dr
- 1410 Valley Forge St
- 615 Azure Hills Dr
- 306 Crestview Dr
- 712 Jenny Wren St
- 302 Cedar Creek Dr
- 1504 N Hills Blvd
- 2012 Foster Branch Ln
- 2008 Foster Branch Ln
- 2013 Woodwind Way
- 2011 Woodwind Way
- 2015 Woodwind Way
- 2014 Foster Branch Ln
- 2006 Foster Branch Ln
- 2013 Foster Branch Ln
- 2011 Foster Branch Ln
- 2009 Woodwind Way
- 2015 Foster Branch Ln
- 2017 Woodwind Way
- 2009 Foster Branch Ln
- 2007 Woodwind Way
- 2004 Foster Branch Ln
- 2017 Foster Branch Ln
- 2007 Foster Branch Ln
- 2016 Foster Branch Ln
- 2019 Woodwind Way
- 2012 Woodwind Way