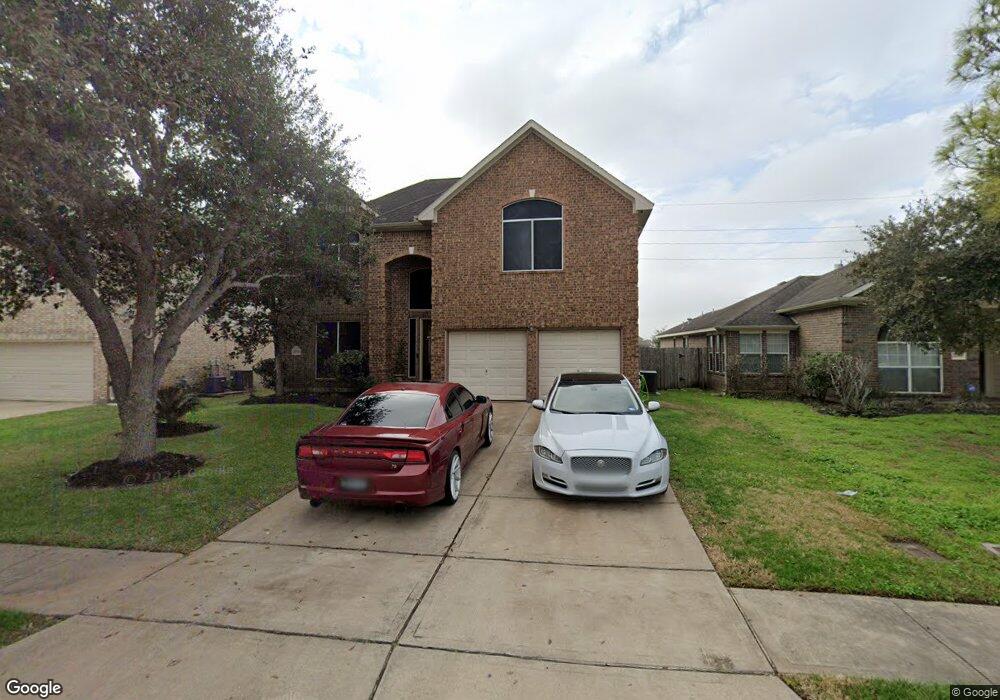
2010 Haven Springs Ln Richmond, TX 77469
Estimated Value: $337,000 - $401,000
4
Beds
3
Baths
2,798
Sq Ft
$130/Sq Ft
Est. Value
About This Home
This home is located at 2010 Haven Springs Ln, Richmond, TX 77469 and is currently estimated at $365,120, approximately $130 per square foot. 2010 Haven Springs Ln is a home located in Fort Bend County with nearby schools including J J Wessendorff Middle School, Lamar Junior High School, and Lamar Consolidated High School.
Ownership History
Date
Name
Owned For
Owner Type
Purchase Details
Closed on
Sep 15, 2006
Sold by
Maplewood Homes Ltd
Bought by
Alexander Laquona G
Current Estimated Value
Home Financials for this Owner
Home Financials are based on the most recent Mortgage that was taken out on this home.
Original Mortgage
$152,792
Outstanding Balance
$96,409
Interest Rate
7.62%
Mortgage Type
Purchase Money Mortgage
Estimated Equity
$268,711
Purchase Details
Closed on
Mar 15, 2006
Sold by
Ransom Partners Ltd
Bought by
Maplewood Homes Ltd
Home Financials for this Owner
Home Financials are based on the most recent Mortgage that was taken out on this home.
Original Mortgage
$748,720
Interest Rate
6.19%
Mortgage Type
Construction
Create a Home Valuation Report for This Property
The Home Valuation Report is an in-depth analysis detailing your home's value as well as a comparison with similar homes in the area
Home Values in the Area
Average Home Value in this Area
Purchase History
| Date | Buyer | Sale Price | Title Company |
|---|---|---|---|
| Alexander Laquona G | -- | Charter Title Co Fort Bend | |
| Maplewood Homes Ltd | -- | Charter Title Ft Bend | |
| Alexander Laquona G | -- | -- |
Source: Public Records
Mortgage History
| Date | Status | Borrower | Loan Amount |
|---|---|---|---|
| Open | Alexander Laquona G | $152,792 | |
| Previous Owner | Alexander Laquona G | $748,720 |
Source: Public Records
Tax History Compared to Growth
Tax History
| Year | Tax Paid | Tax Assessment Tax Assessment Total Assessment is a certain percentage of the fair market value that is determined by local assessors to be the total taxable value of land and additions on the property. | Land | Improvement |
|---|---|---|---|---|
| 2025 | $5,292 | $336,943 | $45,500 | $296,175 |
| 2024 | $5,292 | $306,312 | -- | $307,808 |
| 2023 | $4,793 | $278,465 | $0 | $313,887 |
| 2022 | $5,199 | $253,150 | $0 | $256,610 |
| 2021 | $5,465 | $230,140 | $35,000 | $195,140 |
| 2020 | $5,372 | $222,910 | $35,000 | $187,910 |
| 2019 | $5,607 | $219,550 | $35,000 | $184,550 |
| 2018 | $5,128 | $199,590 | $35,000 | $164,590 |
| 2017 | $5,037 | $193,820 | $35,000 | $158,820 |
| 2016 | $5,135 | $197,580 | $35,000 | $162,580 |
| 2015 | $4,204 | $179,620 | $35,000 | $144,620 |
| 2014 | $4,045 | $166,430 | $35,000 | $131,430 |
Source: Public Records
Map
Nearby Homes
- 1911 Winston Store Loop
- 1810 Winston Store Loop
- 2008 Golden Creek Ln
- 24007 Barnett Overlook
- 23619 Lively Ferry Ln
- 2227 Marian Lee Ln
- 23714 Sweeny Valley Dr
- 23719 Sweeny Valley Dr
- 2236 Par Ln
- 406 Fairway Dr
- 2030 Hays Ranch Dr
- 23743 Travers Hill Rd
- 1622 Boone Hollow Ln
- 23814 Pullin Market Dr
- 2811 Cone Flower Dr
- 2001 Briar Ln
- 0 Meadow Ln
- 2015 Tanglelane St
- 805 Chateau Place
- 1311 Hudgins Pass
- 2008 Haven Springs Ln
- 2012 Haven Springs Ln
- 2006 Haven Springs Ln
- 2014 Haven Springs Ln
- 2004 Haven Springs Ln
- 2016 Haven Springs Ln
- 2011 Haven Springs Ln
- 2009 Haven Springs Ln
- 2013 Haven Springs Ln
- 2007 Haven Springs Ln
- 2015 Haven Springs Ln
- 2002 Haven Springs Ln
- 2005 Haven Springs Ln
- 2017 Haven Springs Ln
- 1854 Smithers Landing Dr
- 2003 Haven Springs Ln
- 2012 Water Trace Ct
- 2014 Water Trace Ct
- 2010 Water Trace Ct
- 2016 Water Trace Ct