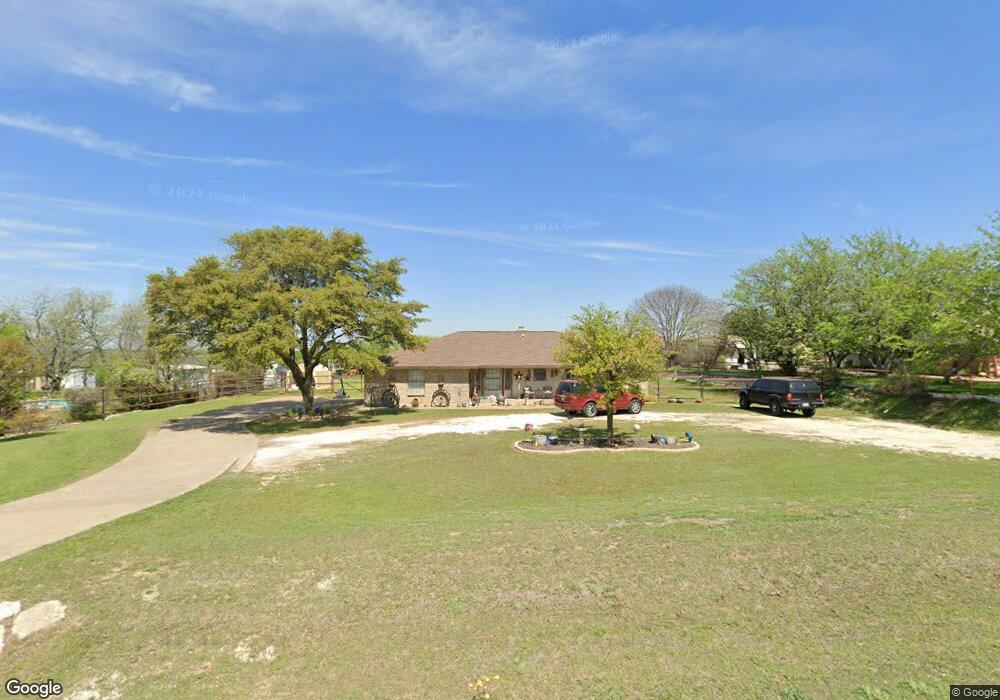
2010 Hill Top Cir Weatherford, TX 76085
Estimated Value: $420,000 - $473,000
--
Bed
--
Bath
1,740
Sq Ft
$255/Sq Ft
Est. Value
About This Home
This home is located at 2010 Hill Top Cir, Weatherford, TX 76085 and is currently estimated at $443,037, approximately $254 per square foot. 2010 Hill Top Cir is a home located in Parker County with nearby schools including Martin Elementary School, Tison Middle School, and Weatherford High School.
Ownership History
Date
Name
Owned For
Owner Type
Purchase Details
Closed on
Jan 13, 2021
Sold by
Vanmeter John T
Bought by
Vanmeter John T and Vanmeter Van Meter
Current Estimated Value
Home Financials for this Owner
Home Financials are based on the most recent Mortgage that was taken out on this home.
Original Mortgage
$208,000
Outstanding Balance
$185,510
Interest Rate
2.67%
Mortgage Type
New Conventional
Estimated Equity
$257,527
Purchase Details
Closed on
Mar 17, 2005
Sold by
Thornhill Robert Dale
Bought by
Vanmeter John T
Home Financials for this Owner
Home Financials are based on the most recent Mortgage that was taken out on this home.
Original Mortgage
$153,000
Interest Rate
5.67%
Purchase Details
Closed on
Mar 5, 1990
Bought by
Vanmeter John T
Purchase Details
Closed on
Nov 1, 1985
Bought by
Vanmeter John T
Create a Home Valuation Report for This Property
The Home Valuation Report is an in-depth analysis detailing your home's value as well as a comparison with similar homes in the area
Home Values in the Area
Average Home Value in this Area
Purchase History
| Date | Buyer | Sale Price | Title Company |
|---|---|---|---|
| Vanmeter John T | -- | None Listed On Document | |
| Vanmeter John T | -- | -- | |
| Meter John T Van | -- | None Available | |
| Vanmeter John T | -- | -- | |
| Vanmeter John T | -- | -- |
Source: Public Records
Mortgage History
| Date | Status | Borrower | Loan Amount |
|---|---|---|---|
| Open | Vanmeter John T | $208,000 | |
| Previous Owner | Meter John T Van | $153,000 | |
| Previous Owner | Meter John T Van | $156,650 |
Source: Public Records
Tax History Compared to Growth
Tax History
| Year | Tax Paid | Tax Assessment Tax Assessment Total Assessment is a certain percentage of the fair market value that is determined by local assessors to be the total taxable value of land and additions on the property. | Land | Improvement |
|---|---|---|---|---|
| 2025 | $4,474 | $388,840 | $115,290 | $273,550 |
| 2024 | $4,474 | $338,239 | -- | -- |
| 2023 | $4,474 | $307,490 | $0 | $0 |
| 2022 | $5,204 | $298,910 | $77,990 | $220,920 |
| 2021 | $5,130 | $298,910 | $77,990 | $220,920 |
| 2020 | $4,686 | $248,950 | $52,430 | $196,520 |
| 2019 | $4,544 | $248,950 | $52,430 | $196,520 |
| 2018 | $4,153 | $190,930 | $28,770 | $162,160 |
| 2017 | $3,862 | $197,240 | $28,770 | $168,470 |
| 2016 | $3,511 | $158,170 | $28,770 | $129,400 |
| 2015 | $3,095 | $158,170 | $28,770 | $129,400 |
| 2014 | $2,951 | $156,100 | $28,770 | $127,330 |
Source: Public Records
Map
Nearby Homes
- 1337 Eagle Dr
- 1301 Eagle Dr
- 116 Sandstone Ln
- 408 Sandridge Dr
- 1305 Green Ridge Rd
- Haven Plan at Wossum Ranch
- 1300 Green Ridge Rd
- Vista Plan at Wossum Ranch
- 777 Trailwood Dr
- 1201 Azle Hwy
- 2526 Hayley Dr
- 2517 Hayley Dr
- 1541 Stanchion Way
- 1605 Stanchion Way
- 707 Gail Dr
- 719 Gail Dr
- 1860 Trailwood Dr
- 1624 Sandle Wood Dr
- Big Cypress II Plan at Waterford Park
- San Gabriel II Plan at Waterford Park
- 1999 Hill Top Cir
- 1950 Hill Top Cir
- 1977 Hill Top Cir
- 2068 Hill Top Cir
- 2041 Hill Top Cir
- 2055 Hill Top Cir
- 1924 Hill Top Cir
- 2102 Hill Top Cir
- 1925 Hill Top Cir
- 2101 Hill Top Cir
- 213 Sandstone Ln
- 205 Sandstone Ln
- 221 Sandstone Ln
- 2130 Hill Top Cir
- 1904 Hill Top Cir
- 1859 Hill Top Cir
- 1902 Hill Top Cir
- 1888 Hill Top Cir
- 1858 Hill Top Cir
- 212 Sandstone Ln