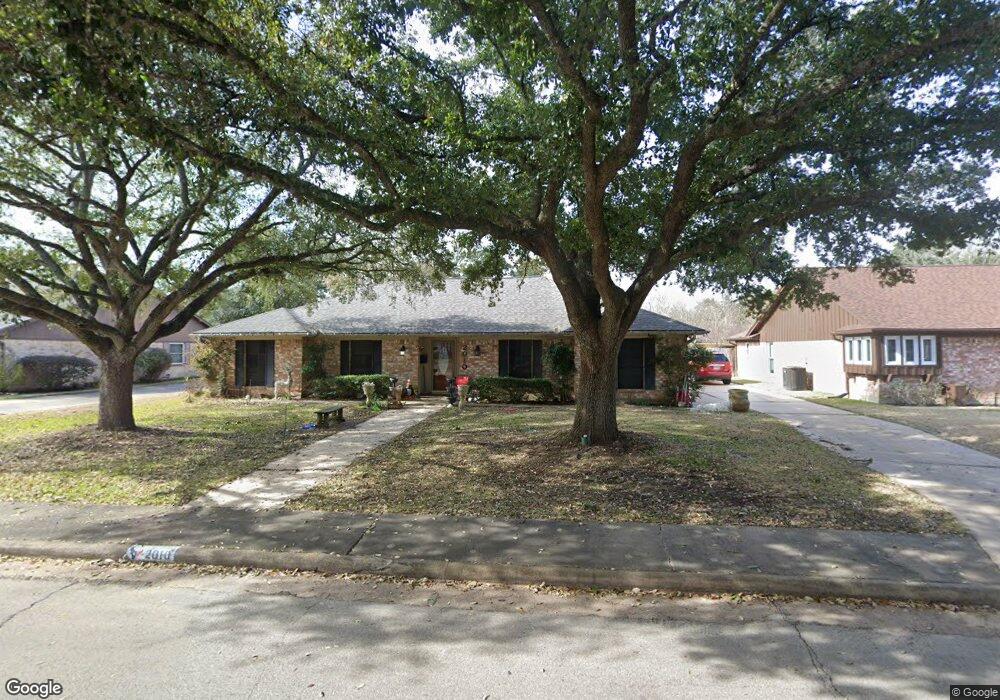
2010 Meadow Ln Richmond, TX 77469
Estimated Value: $295,221 - $326,000
3
Beds
3
Baths
2,212
Sq Ft
$141/Sq Ft
Est. Value
About This Home
This home is located at 2010 Meadow Ln, Richmond, TX 77469 and is currently estimated at $312,055, approximately $141 per square foot. 2010 Meadow Ln is a home located in Fort Bend County with nearby schools including Jane Long Elementary School, J J Wessendorff Middle School, and Lamar Junior High School.
Ownership History
Date
Name
Owned For
Owner Type
Purchase Details
Closed on
Oct 17, 2014
Sold by
Gilhaus Tanya Liane
Bought by
Parnell Micahel and Parnell Maria
Current Estimated Value
Purchase Details
Closed on
Oct 13, 2013
Sold by
Gilhaus Leslie A
Bought by
Parnell Michael and Parnell Maria
Purchase Details
Closed on
Nov 13, 2012
Sold by
Gilhaus Leslie A and Mary Pat
Bought by
Parnell Michael and Parnell Maria
Purchase Details
Closed on
Nov 28, 2005
Sold by
Farris Jeffrey Mark and Farris Susan Elaine
Bought by
Kundig Mary Pat and Gilhaus Leslie A
Home Financials for this Owner
Home Financials are based on the most recent Mortgage that was taken out on this home.
Original Mortgage
$126,300
Interest Rate
6.06%
Mortgage Type
Fannie Mae Freddie Mac
Create a Home Valuation Report for This Property
The Home Valuation Report is an in-depth analysis detailing your home's value as well as a comparison with similar homes in the area
Home Values in the Area
Average Home Value in this Area
Purchase History
| Date | Buyer | Sale Price | Title Company |
|---|---|---|---|
| Parnell Micahel | -- | Stewart Title | |
| Parnell Michael | -- | -- | |
| Parnell Michael | -- | -- | |
| Kundig Mary Pat | -- | Stewart Title Company |
Source: Public Records
Mortgage History
| Date | Status | Borrower | Loan Amount |
|---|---|---|---|
| Previous Owner | Kundig Mary Pat | $126,300 |
Source: Public Records
Tax History Compared to Growth
Tax History
| Year | Tax Paid | Tax Assessment Tax Assessment Total Assessment is a certain percentage of the fair market value that is determined by local assessors to be the total taxable value of land and additions on the property. | Land | Improvement |
|---|---|---|---|---|
| 2025 | $2,394 | $288,624 | $25,755 | $262,869 |
| 2024 | $2,394 | $295,881 | $8,900 | $286,981 |
| 2023 | $2,203 | $268,983 | $0 | $282,572 |
| 2022 | $3,576 | $244,530 | $0 | $287,170 |
| 2021 | $5,279 | $222,300 | $25,760 | $196,540 |
| 2020 | $5,398 | $223,990 | $25,760 | $198,230 |
| 2019 | $5,292 | $207,230 | $25,760 | $181,470 |
| 2018 | $4,864 | $189,330 | $25,760 | $163,570 |
| 2017 | $4,773 | $183,660 | $25,760 | $157,900 |
| 2016 | $4,471 | $172,040 | $25,760 | $146,280 |
| 2015 | $2,932 | $162,610 | $25,760 | $136,850 |
| 2014 | $3,860 | $145,380 | $25,760 | $119,620 |
Source: Public Records
Map
Nearby Homes
- 2015 Tanglelane St
- 5801 Meadow Ln
- 805 Chateau Place
- 2001 Briar Ln
- 1004 Country Club Dr
- 406 Fairway Dr
- 2236 Par Ln
- 0 Fm 2218 Unit 25550047
- 201 Hillcrest Dr
- 400 Hillcrest Dr
- 1922 Teakwood St
- 7315 Audubon Russet Dr
- 7322 Audubon Russet Dr
- 2143 Alabaster Estate Dr
- 1810 Winston Store Loop
- 1911 Winston Store Loop
- 24007 Barnett Overlook
- 24323 Rose Cobbler Dr
- 24351 Dyer Hill Way
- 24331 Dyer Hill Way
- 2008 Meadow Ln
- 2012 Meadow Ln
- 2009 Tanglelane St
- 2007 Tanglelane St
- 2011 Tanglelane St
- 2006 Meadow Ln
- 2014 Meadow Ln
- 2009 Meadow Ln
- 2005 Tanglelane St
- 2007 Meadow Ln
- 2011 Meadow Ln
- 2013 Tanglelane St
- 2004 Meadow Ln
- 2016 Meadow Ln
- 2005 Meadow Ln
- 2013 Meadow Ln
- 2003 Tanglelane St
- 2003 Meadow Ln
- 2015 Meadow Ln
- 2002 Meadow Ln