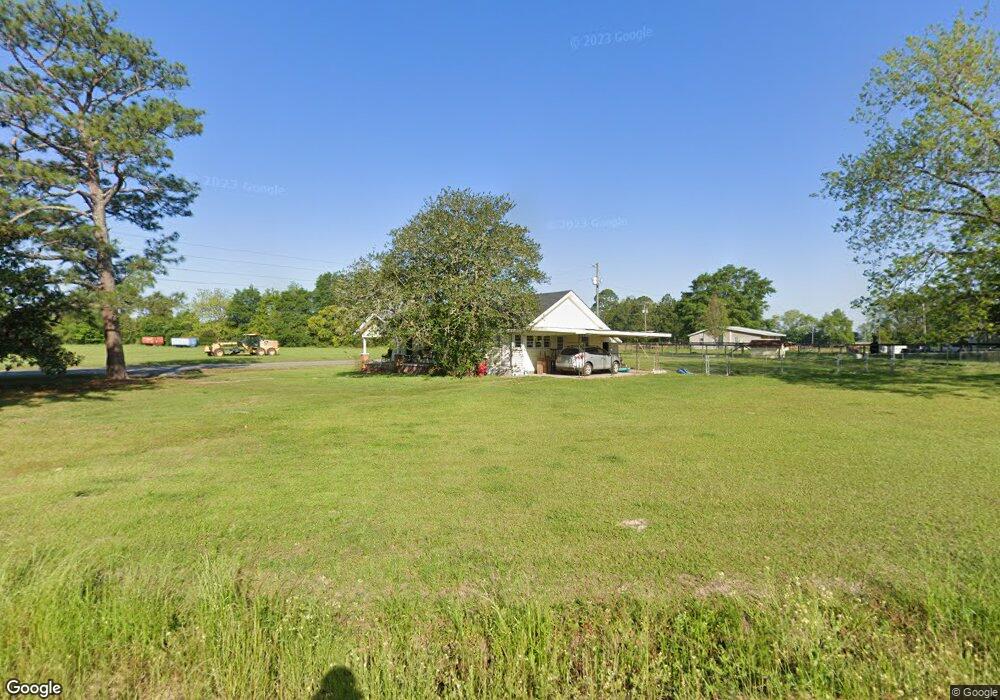
2010 P T Salter Rd Poulan, GA 31781
Estimated Value: $84,000 - $123,000
3
Beds
1
Bath
1,115
Sq Ft
$87/Sq Ft
Est. Value
About This Home
This home is located at 2010 P T Salter Rd, Poulan, GA 31781 and is currently estimated at $97,226, approximately $87 per square foot. 2010 P T Salter Rd is a home located in Worth County with nearby schools including Worth County Primary School, Worth County Elementary School, and Worth County Middle School.
Ownership History
Date
Name
Owned For
Owner Type
Purchase Details
Closed on
Feb 10, 2011
Sold by
Southern Specialty Properties Llc
Bought by
Shotsies Farms Llc
Current Estimated Value
Purchase Details
Closed on
Aug 27, 2010
Sold by
Secretary Of Housing & Urban Development
Bought by
Southern Specialty Properties Llc
Purchase Details
Closed on
Apr 7, 2009
Sold by
Countrywide Home Loans Servicing Lp
Bought by
Secretary Of Housing & Urban Development
Purchase Details
Closed on
Jun 29, 2007
Sold by
Ulm Timothy R
Bought by
King Gene P and King Shirley A
Home Financials for this Owner
Home Financials are based on the most recent Mortgage that was taken out on this home.
Original Mortgage
$54,670
Interest Rate
6.37%
Mortgage Type
FHA
Purchase Details
Closed on
Jan 11, 2006
Sold by
Ulm Candace W
Bought by
Ulm Timothy
Create a Home Valuation Report for This Property
The Home Valuation Report is an in-depth analysis detailing your home's value as well as a comparison with similar homes in the area
Home Values in the Area
Average Home Value in this Area
Purchase History
| Date | Buyer | Sale Price | Title Company |
|---|---|---|---|
| Shotsies Farms Llc | $15,000 | -- | |
| Southern Specialty Properties Llc | $12,000 | -- | |
| Secretary Of Housing & Urban Development | $60,447 | -- | |
| Countrywide Home Loans Servicing Lp | $60,447 | -- | |
| King Gene P | $55,200 | -- | |
| Ulm Timothy | -- | -- |
Source: Public Records
Mortgage History
| Date | Status | Borrower | Loan Amount |
|---|---|---|---|
| Previous Owner | King Gene P | $54,670 |
Source: Public Records
Tax History Compared to Growth
Tax History
| Year | Tax Paid | Tax Assessment Tax Assessment Total Assessment is a certain percentage of the fair market value that is determined by local assessors to be the total taxable value of land and additions on the property. | Land | Improvement |
|---|---|---|---|---|
| 2024 | $777 | $19,906 | $3,520 | $16,386 |
| 2023 | $777 | $19,906 | $3,520 | $16,386 |
| 2022 | $777 | $19,906 | $3,520 | $16,386 |
| 2021 | $809 | $19,906 | $3,520 | $16,386 |
| 2020 | $810 | $19,906 | $3,520 | $16,386 |
| 2019 | $810 | $19,906 | $3,520 | $16,386 |
| 2018 | $570 | $19,906 | $3,520 | $16,386 |
| 2017 | $570 | $19,906 | $3,520 | $16,386 |
| 2016 | $516 | $19,906 | $3,520 | $16,386 |
| 2015 | $571 | $19,906 | $3,520 | $16,386 |
| 2014 | $571 | $19,906 | $3,520 | $16,386 |
| 2013 | -- | $18,850 | $2,464 | $16,386 |
| 2012 | -- | $18,849 | $2,464 | $16,385 |
Source: Public Records
Map
Nearby Homes
- 196 Griffin Houston Rd
- 107 Dunbar Cir
- 103 Dunbar Cir
- 106 Rosewood Dr
- 104 Lynn Cir
- 117 Donna Dr
- 565 Sands Dr Unit 8
- 565 Sands Dr
- 0 Sands Dr
- 0 P T Salter Rd Unit 138997
- 376 West Rd
- 0 Multiple Lots Unit 138826
- 185 Hudson Rd
- 202A E Welch St
- 112 Creekwood Cir
- 0 Ga Hwy 82 Unit 913408
- 402 N McPhaul St
- 000 Georgia 256
- 101 Pecan St
- 307 E Hobson St
- N McGirt
- 267 Poulan Shingler Rd
- 208 Milling Rd
- 429 Poulan Shingler Rd
- 135 Mary Ln
- 434 Poulan Shingler Rd
- 251 Poulan Shingler Rd
- 439 Poulan Shingler Rd
- 441 Poulan Shingler Rd
- 239 Poulan Shingler Rd
- 449 Poulan Shingler Rd
- 443 Poulan Shingler Rd
- 278 Griffin Houston Rd
- 198 Milling Rd
- 122 Mary Ln
- 307 Whiddon Mill Rd
- 155 Whiddon Mill Rd
- 135 Whiddon Mill Rd
- 294 Griffin Houston Rd
- 400 Griffin Houston Rd