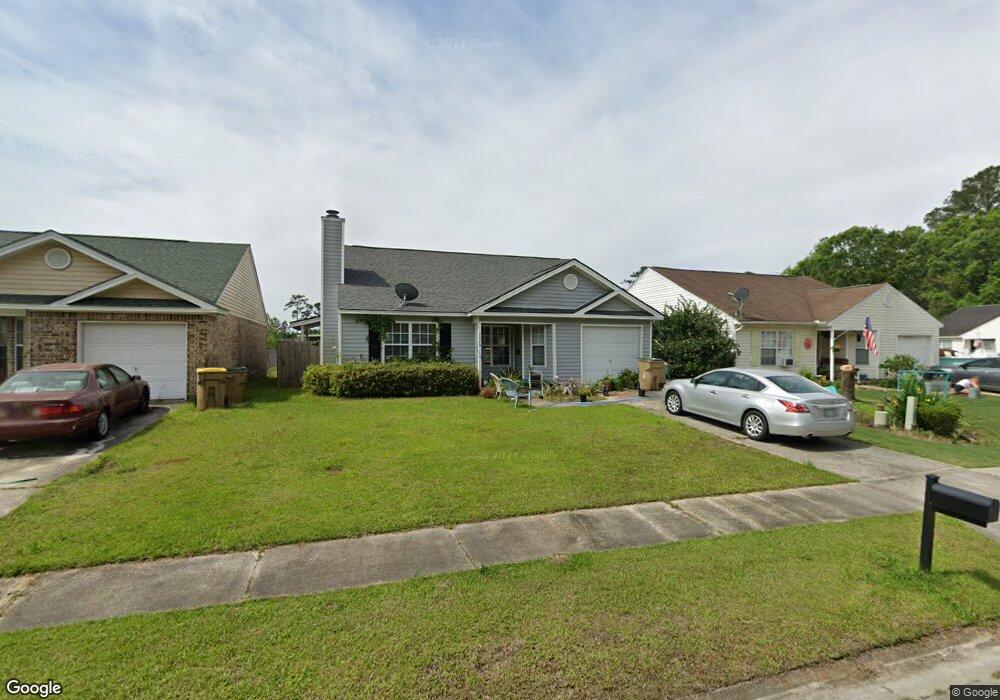
2010 Rushing St Richmond Hill, GA 31324
Estimated Value: $232,000 - $283,000
3
Beds
2
Baths
1,200
Sq Ft
$215/Sq Ft
Est. Value
About This Home
This home is located at 2010 Rushing St, Richmond Hill, GA 31324 and is currently estimated at $257,582, approximately $214 per square foot. 2010 Rushing St is a home located in Bryan County with nearby schools including Richmond Hill Primary School, Dr. George Washington Carver Elementary School, and Richmond Hill Elementary School.
Ownership History
Date
Name
Owned For
Owner Type
Purchase Details
Closed on
Jan 26, 2023
Sold by
Oglethorpe Properties Group Llc
Bought by
Longgrear Paul Richard
Current Estimated Value
Purchase Details
Closed on
May 18, 2016
Sold by
Ohara Arnold
Bought by
Oglethorpe Properties Grp Llc
Home Financials for this Owner
Home Financials are based on the most recent Mortgage that was taken out on this home.
Original Mortgage
$55,000
Interest Rate
3.59%
Mortgage Type
Commercial
Purchase Details
Closed on
Jul 1, 2003
Sold by
O'Hara Thomas and O'Hara Louise
Bought by
O'Hara Hazel Henson
Purchase Details
Closed on
Aug 16, 2002
Sold by
Regal Builders Of The
Bought by
O'Hara Thomas and O'Hara Louise
Purchase Details
Closed on
Jun 24, 2002
Sold by
Bls Development Inc
Bought by
Regal Builders Of The
Purchase Details
Closed on
Feb 11, 2000
Bought by
Bls Development Inc
Create a Home Valuation Report for This Property
The Home Valuation Report is an in-depth analysis detailing your home's value as well as a comparison with similar homes in the area
Home Values in the Area
Average Home Value in this Area
Purchase History
| Date | Buyer | Sale Price | Title Company |
|---|---|---|---|
| Longgrear Paul Richard | $190,000 | -- | |
| Oglethorpe Properties Grp Llc | $65,000 | -- | |
| O'Hara Hazel Henson | -- | -- | |
| O'Hara Thomas | $89,500 | -- | |
| Regal Builders Of The | $12,500 | -- | |
| Bls Development Inc | $149,500 | -- |
Source: Public Records
Mortgage History
| Date | Status | Borrower | Loan Amount |
|---|---|---|---|
| Previous Owner | Oglethorpe Properties Grp Llc | $55,000 |
Source: Public Records
Tax History Compared to Growth
Tax History
| Year | Tax Paid | Tax Assessment Tax Assessment Total Assessment is a certain percentage of the fair market value that is determined by local assessors to be the total taxable value of land and additions on the property. | Land | Improvement |
|---|---|---|---|---|
| 2024 | $2,250 | $76,880 | $16,000 | $60,880 |
| 2023 | $2,250 | $66,960 | $16,000 | $50,960 |
| 2022 | $2,079 | $66,000 | $16,000 | $50,000 |
| 2021 | $1,484 | $45,240 | $16,000 | $29,240 |
| 2020 | $1,313 | $45,240 | $16,000 | $29,240 |
| 2019 | $1,455 | $43,400 | $14,000 | $29,400 |
| 2018 | $1,269 | $43,000 | $14,000 | $29,000 |
| 2017 | $1,161 | $42,280 | $12,800 | $29,480 |
| 2016 | $1,166 | $41,800 | $12,800 | $29,000 |
| 2015 | -- | $41,600 | $12,800 | $28,800 |
| 2014 | -- | $42,320 | $12,800 | $29,520 |
Source: Public Records
Map
Nearby Homes
- 275 Carter St
- 330 Carter St
- 285 Rushing St
- 73 2nd St
- 262 Camellia St
- 72 Richmond Way
- 177 Spruce St
- 150 Blue Oak Dr
- 267 Young Way
- 43 Timberland Trail
- 10 Evergreen Oak Dr
- 420 Canyon Oak Loop
- 40 Bush Ct
- 1125 Canyon Oak Loop
- 40 Patton Ln
- 179 Byron Dr
- 130 Stafford Loop
- 134 Stafford Loop
- 0 U S 17 Unit 324920
- 219 Byron Dr
- 1090 Rushing St
- 2030 Rushing St
- 1070 Rushing St
- 2050 Rushing St
- 1050 Rushing St
- 3005 Rushing St
- 2070 Rushing St
- 3025 Rushing St
- 510 Rushing St
- 2025 Rushing St
- 3045 Rushing St
- 2085 Rushing St
- 2045 Rushing St
- 530 Rushing St
- 2005 Rushing St
- 1030 Rushing St
- 2065 Rushing St
- 1085 Rushing St
- 2090 Rushing St
- 3065 Rushing St