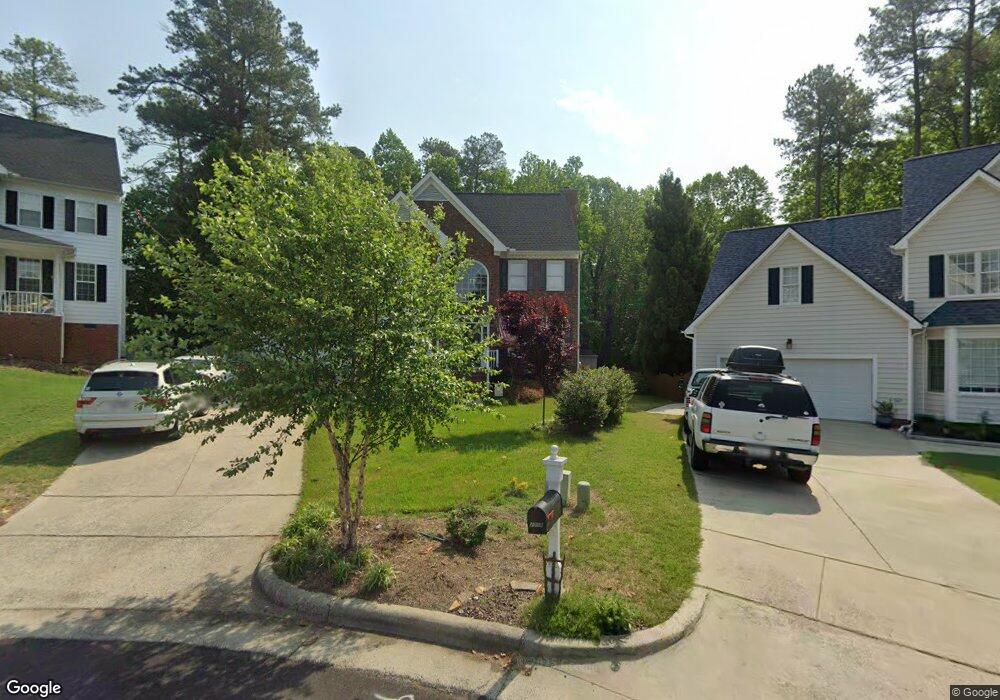
2010 Sassacus Ln Apex, NC 27523
West Cary NeighborhoodEstimated Value: $683,000 - $750,000
4
Beds
3
Baths
2,644
Sq Ft
$272/Sq Ft
Est. Value
About This Home
This home is located at 2010 Sassacus Ln, Apex, NC 27523 and is currently estimated at $719,857, approximately $272 per square foot. 2010 Sassacus Ln is a home located in Wake County with nearby schools including Salem Elementary, Salem Middle, and Green Hope High.
Ownership History
Date
Name
Owned For
Owner Type
Purchase Details
Closed on
Nov 7, 2017
Sold by
Harvey Scott W and Harvey Laurie A
Bought by
Harvey Scott W and Harvey Laurie Ann
Current Estimated Value
Purchase Details
Closed on
Nov 2, 2001
Sold by
Dixon Robert P and Dixon Suzanne R
Bought by
Harvey Scott W and Harvey Laurie A
Home Financials for this Owner
Home Financials are based on the most recent Mortgage that was taken out on this home.
Original Mortgage
$208,800
Interest Rate
6.49%
Purchase Details
Closed on
Oct 11, 1999
Sold by
Kenney Timothy H
Bought by
Dixon Robert P and Dixon Suzanne R
Home Financials for this Owner
Home Financials are based on the most recent Mortgage that was taken out on this home.
Original Mortgage
$176,000
Interest Rate
7.79%
Purchase Details
Closed on
Feb 26, 1999
Sold by
The Drees Company
Bought by
Kenney Timothy H and Kenney Tracye S
Home Financials for this Owner
Home Financials are based on the most recent Mortgage that was taken out on this home.
Original Mortgage
$168,440
Interest Rate
6.74%
Create a Home Valuation Report for This Property
The Home Valuation Report is an in-depth analysis detailing your home's value as well as a comparison with similar homes in the area
Home Values in the Area
Average Home Value in this Area
Purchase History
| Date | Buyer | Sale Price | Title Company |
|---|---|---|---|
| Harvey Scott W | -- | None Available | |
| Harvey Scott W | $261,000 | -- | |
| Dixon Robert P | $226,000 | -- | |
| Kenney Timothy H | $211,000 | -- |
Source: Public Records
Mortgage History
| Date | Status | Borrower | Loan Amount |
|---|---|---|---|
| Previous Owner | Harvey Scott W | $208,800 | |
| Previous Owner | Dixon Robert P | $176,000 | |
| Previous Owner | Kenney Timothy H | $168,440 | |
| Closed | Kenney Timothy H | $21,055 | |
| Closed | Harvey Scott W | $26,100 |
Source: Public Records
Tax History Compared to Growth
Tax History
| Year | Tax Paid | Tax Assessment Tax Assessment Total Assessment is a certain percentage of the fair market value that is determined by local assessors to be the total taxable value of land and additions on the property. | Land | Improvement |
|---|---|---|---|---|
| 2025 | $5,803 | $662,351 | $200,000 | $462,351 |
| 2024 | $5,673 | $662,351 | $200,000 | $462,351 |
| 2023 | $4,699 | $426,547 | $120,000 | $306,547 |
| 2022 | $4,411 | $426,547 | $120,000 | $306,547 |
| 2021 | $4,243 | $426,547 | $120,000 | $306,547 |
| 2020 | $3,935 | $399,534 | $120,000 | $279,534 |
| 2019 | $3,455 | $302,474 | $84,000 | $218,474 |
| 2018 | $3,255 | $302,474 | $84,000 | $218,474 |
| 2017 | $3,030 | $302,474 | $84,000 | $218,474 |
| 2016 | $2,986 | $302,474 | $84,000 | $218,474 |
| 2015 | $2,954 | $292,086 | $74,000 | $218,086 |
| 2014 | -- | $292,086 | $74,000 | $218,086 |
Source: Public Records
Map
Nearby Homes
- 2021 Patapsco Dr
- 320 Sutton Glen Dr
- 1808 Beaudet Ln
- 106 Daleshire Dr
- 114 Calebra Way
- 700 Oak Ridge Dr
- 2013 Keokuk Ct
- 712 Oak Ridge Dr
- 721 Oak Ridge Dr
- 708 Oak Ridge Dr
- 705 Oak Ridge Dr
- 720 Oak Ridge Dr
- 709 Oak Ridge Dr
- 713 Oak Ridge Dr
- 105 Catchpenny Ct
- 7736 Roberts Rd
- 552 Rowanwood Way
- 538 Rowanwood Way
- 100 Wentbridge Rd
- 6716 Valley Woods Ln
- 2009 Sassacus Ln
- 2008 Sassacus Ln
- 2006 Sassacus Ln
- 2007 Sassacus Ln
- 2005 Sassacus Ln
- 2004 Sassacus Ln
- 1257 Hill Hollow Way
- 1261 Hill Hollow Way
- 1253 Hill Hollow Way
- 1265 Hill Hollow Way
- 2003 Sassacus Ln
- 1269 Hill Hollow Way
- 2434 Castleburg Dr
- 2436 Castleburg Dr
- 2002 Sassacus Ln
- 2438 Castleburg Dr
- 2432 Castleburg Dr
- 1273 Hill Hollow Way
- 1249 Hill Hollow Way
- 2010 Templeton Gap Dr