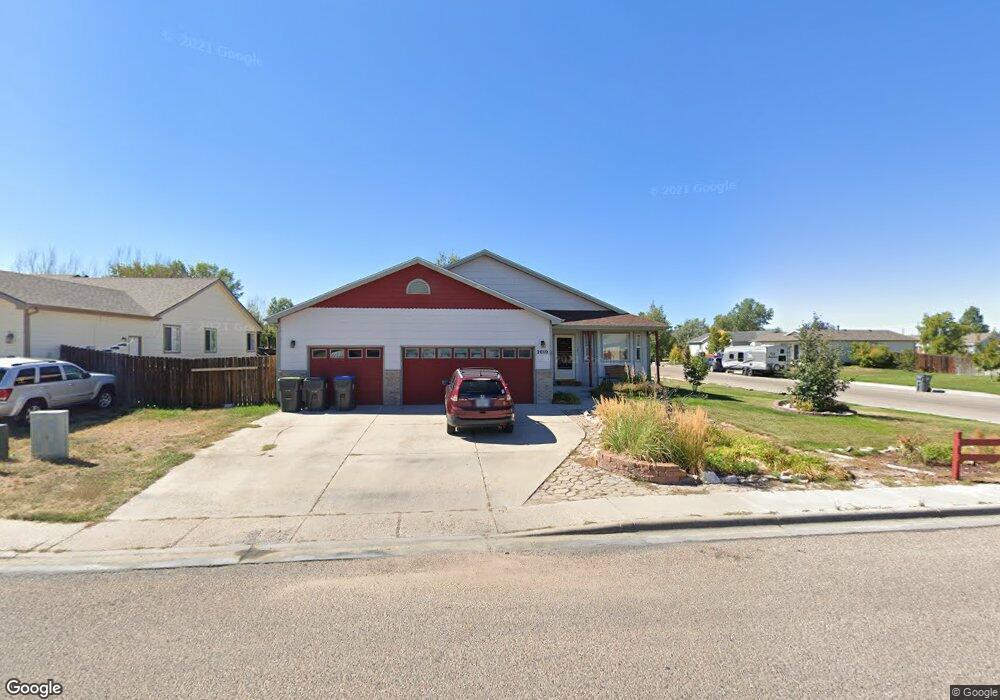
2010 Silverton Dr Cheyenne, WY 82001
Estimated Value: $460,000 - $513,987
5
Beds
2
Baths
1,488
Sq Ft
$326/Sq Ft
Est. Value
About This Home
This home is located at 2010 Silverton Dr, Cheyenne, WY 82001 and is currently estimated at $484,497, approximately $325 per square foot. 2010 Silverton Dr is a home located in Laramie County with nearby schools including Sunrise Elementary School, Johnson Junior High School, and South High School.
Ownership History
Date
Name
Owned For
Owner Type
Purchase Details
Closed on
Oct 28, 2019
Sold by
Anderson Mark Eric and Baker Francine M
Bought by
Johnson Steven A and Johnson Angelique R
Current Estimated Value
Home Financials for this Owner
Home Financials are based on the most recent Mortgage that was taken out on this home.
Original Mortgage
$323,023
Interest Rate
3.7%
Mortgage Type
New Conventional
Purchase Details
Closed on
Oct 5, 2007
Sold by
Anderson Mark Eric
Bought by
Anderson Mark Eric and Baker Francine M
Purchase Details
Closed on
Sep 21, 2001
Sold by
Rocking K Construction Inc
Bought by
Anderson Mark E
Home Financials for this Owner
Home Financials are based on the most recent Mortgage that was taken out on this home.
Original Mortgage
$122,160
Interest Rate
6.96%
Create a Home Valuation Report for This Property
The Home Valuation Report is an in-depth analysis detailing your home's value as well as a comparison with similar homes in the area
Home Values in the Area
Average Home Value in this Area
Purchase History
| Date | Buyer | Sale Price | Title Company |
|---|---|---|---|
| Johnson Steven A | -- | First American | |
| Anderson Mark Eric | -- | None Available | |
| Anderson Mark E | -- | -- |
Source: Public Records
Mortgage History
| Date | Status | Borrower | Loan Amount |
|---|---|---|---|
| Open | Johnson Steven A | $323,023 | |
| Previous Owner | Anderson Mark E | $122,160 |
Source: Public Records
Tax History Compared to Growth
Tax History
| Year | Tax Paid | Tax Assessment Tax Assessment Total Assessment is a certain percentage of the fair market value that is determined by local assessors to be the total taxable value of land and additions on the property. | Land | Improvement |
|---|---|---|---|---|
| 2025 | $2,874 | $31,895 | $4,487 | $27,408 |
| 2024 | $2,874 | $40,645 | $5,982 | $34,663 |
| 2023 | $2,882 | $40,764 | $5,982 | $34,782 |
| 2022 | $2,237 | $30,987 | $5,982 | $25,005 |
| 2021 | $2,105 | $29,095 | $5,982 | $23,113 |
| 2020 | $1,999 | $27,708 | $5,982 | $21,726 |
| 2019 | $1,851 | $25,632 | $5,982 | $19,650 |
| 2018 | $1,782 | $24,915 | $5,918 | $18,997 |
| 2017 | $1,734 | $24,030 | $4,631 | $19,399 |
| 2016 | $1,639 | $22,701 | $4,620 | $18,081 |
| 2015 | $1,564 | $21,659 | $4,620 | $17,039 |
| 2014 | $1,561 | $21,477 | $4,620 | $16,857 |
Source: Public Records
Map
Nearby Homes
- 4904 E Pershing Blvd
- 1720 Maroon Dr
- 2015 Appaloosa Dr
- 5816 Parkside Dr
- 4701 Long Branch Loop
- Tr 3 E Pershing Blvd
- TR 2 E Pershing Blvd
- 5724 Parkside Dr
- 1913 Prairie Dog Dr
- 1511 Gettysburg Dr
- 4811 E 14th St
- TBD Taft Ave
- 4802 E 13th St
- 4404 Cottage Ln
- 1519 Adams Ave
- 1442 Monroe Ct
- 3540 Saratoga St
- 828 Sun Valley Dr
- 1415 Adams Ave
- 4002 Cheyenne St
- 2002 Silverton Dr
- 5015 Foxen Ct
- 5026 Foxen Ct
- 1920 Silverton Dr
- 5016 Foxen Ct
- 5007 Foxen Ct
- 2003 Silverton Dr
- 2009 Silverton Dr
- 2015 Silverton Dr
- 5008 Sunny Hill Dr
- 1921 Silverton Dr
- 2023 Silverton Dr
- 5006 Foxen Ct
- 1912 Silverton Dr
- 2209 Meadow Dr
- 1915 Silverton Dr
- 2217 Meadow Dr
- 5001 Foxen Ct
- 2018 Gettysburg Dr
- 2023 Gettysburg Dr