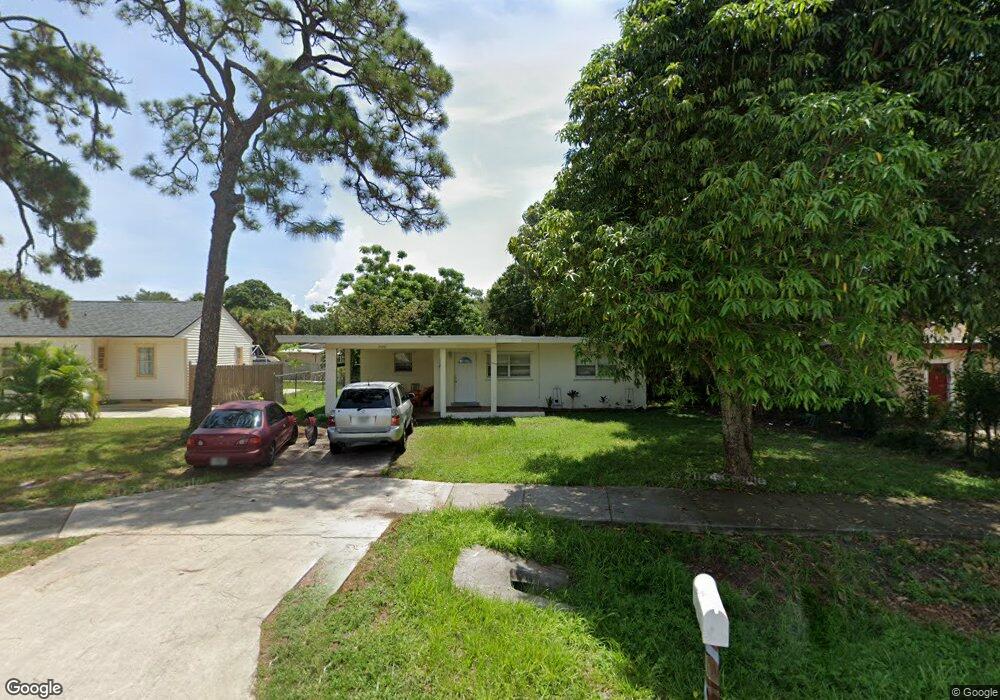
2010 Sunrise Blvd Fort Pierce, FL 34950
Downtown Fort Pierce NeighborhoodEstimated Value: $180,000 - $272,000
2
Beds
1
Bath
953
Sq Ft
$221/Sq Ft
Est. Value
About This Home
This home is located at 2010 Sunrise Blvd, Fort Pierce, FL 34950 and is currently estimated at $210,786, approximately $221 per square foot. 2010 Sunrise Blvd is a home located in St. Lucie County with nearby schools including St. Lucie Elementary School, Lawnwood Elementary School, and Chester A. Moore Elementary School.
Ownership History
Date
Name
Owned For
Owner Type
Purchase Details
Closed on
Apr 24, 2015
Sold by
Carlson Family Llc
Bought by
Jacobson Oeun
Current Estimated Value
Purchase Details
Closed on
Apr 7, 2015
Sold by
County Of St Lucie
Bought by
Carlson Family Llc
Purchase Details
Closed on
Mar 24, 2006
Sold by
Jacobson Roger and Jacobson Oeun
Bought by
Miller Novlette Whyte
Home Financials for this Owner
Home Financials are based on the most recent Mortgage that was taken out on this home.
Original Mortgage
$96,050
Interest Rate
9.85%
Mortgage Type
Fannie Mae Freddie Mac
Purchase Details
Closed on
Nov 15, 2002
Sold by
Burrescia Ruth E and Burrescia Charles
Bought by
Jacobson Roger and Jacobson Oeun
Home Financials for this Owner
Home Financials are based on the most recent Mortgage that was taken out on this home.
Original Mortgage
$50,000
Interest Rate
5.95%
Create a Home Valuation Report for This Property
The Home Valuation Report is an in-depth analysis detailing your home's value as well as a comparison with similar homes in the area
Home Values in the Area
Average Home Value in this Area
Purchase History
| Date | Buyer | Sale Price | Title Company |
|---|---|---|---|
| Jacobson Oeun | -- | None Available | |
| Carlson Family Llc | $14,800 | None Available | |
| Miller Novlette Whyte | $113,300 | Landtech Title Courthouse | |
| Jacobson Roger | $60,000 | -- |
Source: Public Records
Mortgage History
| Date | Status | Borrower | Loan Amount |
|---|---|---|---|
| Previous Owner | Miller Novlette Whyte | $96,050 | |
| Previous Owner | Jacobson Roger | $50,000 |
Source: Public Records
Tax History Compared to Growth
Tax History
| Year | Tax Paid | Tax Assessment Tax Assessment Total Assessment is a certain percentage of the fair market value that is determined by local assessors to be the total taxable value of land and additions on the property. | Land | Improvement |
|---|---|---|---|---|
| 2025 | $2,347 | $76,392 | $34,629 | $41,763 |
| 2024 | $2,197 | $164,900 | $71,800 | $93,100 |
| 2023 | $2,197 | $154,400 | $61,400 | $93,000 |
| 2022 | $2,039 | $143,500 | $57,200 | $86,300 |
| 2021 | $1,755 | $105,200 | $37,300 | $67,900 |
| 2020 | $1,500 | $77,700 | $17,900 | $59,800 |
| 2019 | $1,442 | $78,300 | $15,100 | $63,200 |
| 2018 | $1,200 | $63,800 | $12,400 | $51,400 |
| 2017 | $1,026 | $45,100 | $11,100 | $34,000 |
| 2016 | $888 | $32,400 | $5,900 | $26,500 |
| 2015 | $904 | $32,500 | $5,900 | $26,600 |
| 2014 | -- | $37,300 | $0 | $0 |
Source: Public Records
Map
Nearby Homes
- 2007 Oleander Blvd Unit D
- 2007 Oleander Blvd Unit C
- 2005 Oleander Blvd Unit D
- 2001 Oleander Blvd Unit C
- 2018 S 10th St Unit C
- 2019 Oleander Blvd Unit B
- 2050 Oleander Blvd Unit 1-303
- 2050 Oleander Blvd Unit 5-104
- 2050 Oleander Blvd Unit 4-105
- 2050 Oleander Blvd Unit 6-102
- 2050 Oleander Blvd Unit 4-206
- 2050 Oleander Blvd Unit 2-206
- 2050 Oleander Blvd Unit 8202
- 2050 Oleander Blvd Unit 5306
- 2050 Oleander Blvd Unit 2-105
- 2050 Oleander Blvd Unit 5-301
- 2050 Oleander Blvd Unit 1105
- 2050 Oleander Blvd Unit 2-106
- 2050 Oleander Blvd Unit 4106
- 2302 Sunrise Blvd Unit 202
- 2014 Sunrise Blvd
- 2008 NW Sunrise
- 2008 Sunrise Blvd
- 2016 Sunrise Blvd
- 2011 S 10th St
- 2007 S 10th St
- 2013 S 10th St
- 2006 Sunrise Blvd
- 2018 Sunrise Blvd
- 2005 S 10th St
- 2015 S 10th St
- 2007 Sunrise Blvd
- 2017 Sunrise Blvd
- 2003 Sunrise Blvd
- 2020 Sunrise Blvd
- 2001 S 10th St
- 2010 S 10th St
- 2010 S 10th St Unit C
- 2010 S 10th St Unit B
- 2010 S 10th St Unit A