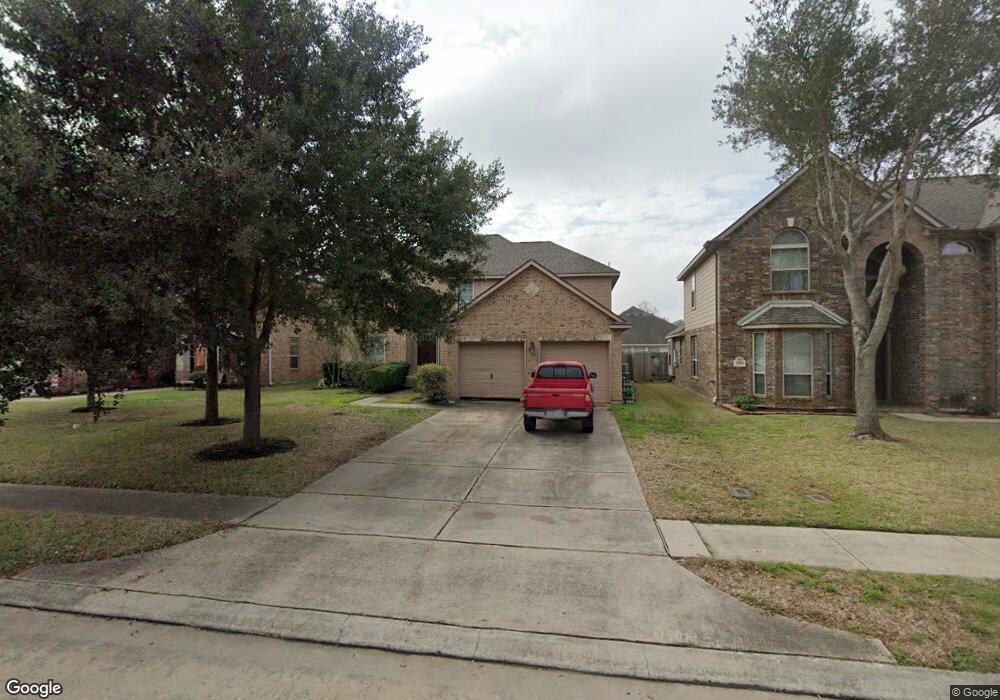
2010 Water Trace Ct Richmond, TX 77469
Estimated Value: $331,000 - $420,000
4
Beds
3
Baths
2,710
Sq Ft
$134/Sq Ft
Est. Value
About This Home
This home is located at 2010 Water Trace Ct, Richmond, TX 77469 and is currently estimated at $363,245, approximately $134 per square foot. 2010 Water Trace Ct is a home located in Fort Bend County with nearby schools including J J Wessendorff Middle School, Lamar Junior High School, and Lamar Consolidated High School.
Ownership History
Date
Name
Owned For
Owner Type
Purchase Details
Closed on
May 31, 2011
Sold by
Omnibank N A
Bought by
Garza Mario and Garza Claudia
Current Estimated Value
Home Financials for this Owner
Home Financials are based on the most recent Mortgage that was taken out on this home.
Original Mortgage
$171,765
Outstanding Balance
$119,627
Interest Rate
4.85%
Mortgage Type
Seller Take Back
Estimated Equity
$243,618
Purchase Details
Closed on
Mar 3, 2011
Sold by
Maplewood Homes Ltd
Bought by
Omnibank N A
Purchase Details
Closed on
Aug 16, 2007
Sold by
Ransom Partners Ltd
Bought by
Maplewood Homes Ltd
Home Financials for this Owner
Home Financials are based on the most recent Mortgage that was taken out on this home.
Original Mortgage
$148,000
Interest Rate
6.64%
Mortgage Type
Purchase Money Mortgage
Create a Home Valuation Report for This Property
The Home Valuation Report is an in-depth analysis detailing your home's value as well as a comparison with similar homes in the area
Home Values in the Area
Average Home Value in this Area
Purchase History
| Date | Buyer | Sale Price | Title Company |
|---|---|---|---|
| Garza Mario | -- | Charter Title Company | |
| Omnibank N A | $319,500 | None Available | |
| Garza Mario | -- | -- | |
| Maplewood Homes Ltd | -- | Charter Title Company | |
| Garza Mario | -- | -- |
Source: Public Records
Mortgage History
| Date | Status | Borrower | Loan Amount |
|---|---|---|---|
| Open | Garza Mario | $171,765 | |
| Previous Owner | Garza Mario | $148,000 |
Source: Public Records
Tax History Compared to Growth
Tax History
| Year | Tax Paid | Tax Assessment Tax Assessment Total Assessment is a certain percentage of the fair market value that is determined by local assessors to be the total taxable value of land and additions on the property. | Land | Improvement |
|---|---|---|---|---|
| 2025 | $5,208 | $332,523 | $48,100 | $296,006 |
| 2024 | $5,208 | $302,294 | $2,267 | $300,027 |
| 2023 | $4,716 | $274,813 | $0 | $306,008 |
| 2022 | $5,124 | $249,830 | $0 | $256,330 |
| 2021 | $5,394 | $227,120 | $37,000 | $190,120 |
| 2020 | $5,304 | $220,070 | $37,000 | $183,070 |
| 2019 | $5,545 | $217,100 | $37,000 | $180,100 |
| 2018 | $5,070 | $197,360 | $37,000 | $160,360 |
| 2017 | $5,078 | $195,380 | $37,000 | $158,380 |
| 2016 | $5,190 | $199,670 | $37,000 | $162,670 |
| 2015 | $4,252 | $181,520 | $37,000 | $144,520 |
| 2014 | $4,009 | $165,020 | $37,000 | $128,020 |
Source: Public Records
Map
Nearby Homes
- 2008 Golden Creek Ln
- 1911 Winston Store Loop
- 1810 Winston Store Loop
- 24007 Barnett Overlook
- 2227 Marian Lee Ln
- 23619 Lively Ferry Ln
- 406 Fairway Dr
- 23714 Sweeny Valley Dr
- 23719 Sweeny Valley Dr
- 2030 Hays Ranch Dr
- 2236 Par Ln
- 23743 Travers Hill Rd
- 1622 Boone Hollow Ln
- 2001 Briar Ln
- 23814 Pullin Market Dr
- 2811 Cone Flower Dr
- 0 Meadow Ln
- 400 Hillcrest Dr
- 7315 Audubon Russet Dr
- 7322 Audubon Russet Dr
- 2012 Water Trace Ct
- 2008 Water Trace Ct
- 2014 Water Trace Ct
- 2009 Haven Springs Ln
- 2007 Haven Springs Ln
- 2006 Water Trace Ct
- 2011 Haven Springs Ln
- 2005 Haven Springs Ln
- 2016 Water Trace Ct
- 2004 Water Trace Ct
- 2009 Water Trace Ct
- 2013 Haven Springs Ln
- 2011 Water Trace Ct
- 2011 Water Trace Ct
- 2003 Haven Springs Ln
- 2007 Water Trace Ct
- 2013 Water Trace Ct
- 2018 Water Trace Ct
- 2005 Water Trace Ct
- 2015 Haven Springs Ln