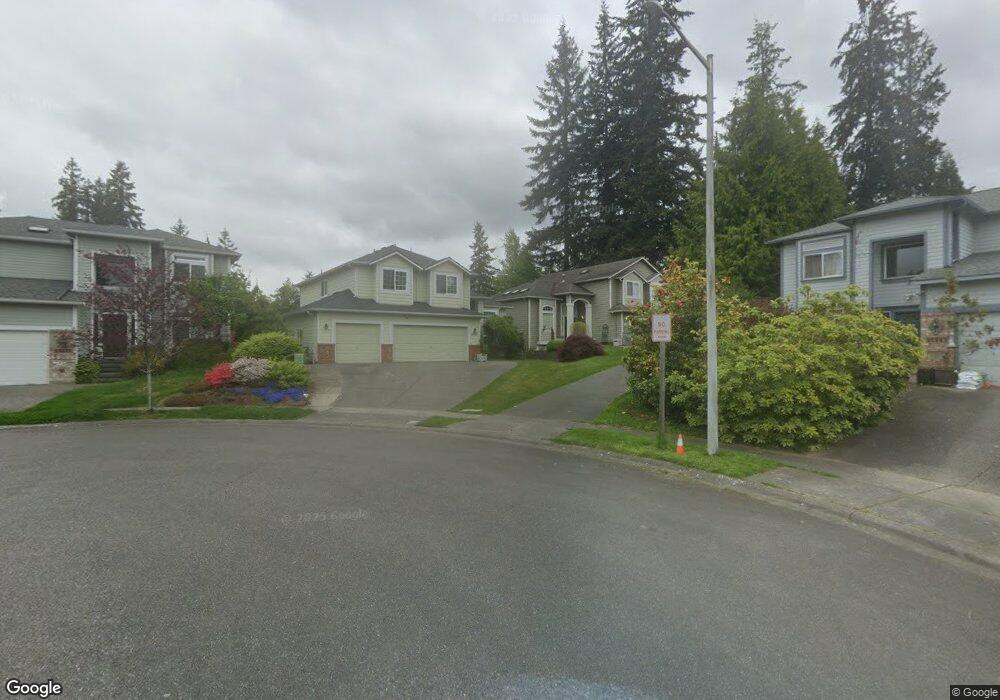
20103 7th Ave SE Bothell, WA 98012
Queensborough-Brentwood NeighborhoodEstimated Value: $976,000 - $1,118,000
4
Beds
3
Baths
1,946
Sq Ft
$527/Sq Ft
Est. Value
About This Home
This home is located at 20103 7th Ave SE, Bothell, WA 98012 and is currently estimated at $1,025,390, approximately $526 per square foot. 20103 7th Ave SE is a home located in Snohomish County with nearby schools including Crystal Springs Elementary School, Canyon Park Junior High School, and Bothell High School.
Ownership History
Date
Name
Owned For
Owner Type
Purchase Details
Closed on
Sep 16, 2005
Sold by
Phung Sanh Vi
Bought by
Phung Sanh Vi and Phung My
Current Estimated Value
Home Financials for this Owner
Home Financials are based on the most recent Mortgage that was taken out on this home.
Original Mortgage
$153,271
Interest Rate
5.76%
Mortgage Type
Fannie Mae Freddie Mac
Purchase Details
Closed on
Sep 7, 2005
Sold by
Phung Teresa Tranhue
Bought by
Phung Sanh Vi and Phung My
Home Financials for this Owner
Home Financials are based on the most recent Mortgage that was taken out on this home.
Original Mortgage
$153,271
Interest Rate
5.76%
Mortgage Type
Fannie Mae Freddie Mac
Purchase Details
Closed on
Jul 19, 1996
Sold by
Tim Canfield Construction Inc
Bought by
Nguyen Phung Sanh Vi and Nguyen Phung Phan
Home Financials for this Owner
Home Financials are based on the most recent Mortgage that was taken out on this home.
Original Mortgage
$182,500
Interest Rate
8.39%
Create a Home Valuation Report for This Property
The Home Valuation Report is an in-depth analysis detailing your home's value as well as a comparison with similar homes in the area
Home Values in the Area
Average Home Value in this Area
Purchase History
| Date | Buyer | Sale Price | Title Company |
|---|---|---|---|
| Phung Sanh Vi | $56,179 | Chicago Title | |
| Phung Sanh Vi | $40,653 | Chicago Title | |
| Nguyen Phung Sanh Vi | $192,500 | Chicago Title Ins Co |
Source: Public Records
Mortgage History
| Date | Status | Borrower | Loan Amount |
|---|---|---|---|
| Closed | Phung Sanh Vi | $153,271 | |
| Previous Owner | Nguyen Phung Sanh Vi | $182,500 |
Source: Public Records
Tax History
| Year | Tax Paid | Tax Assessment Tax Assessment Total Assessment is a certain percentage of the fair market value that is determined by local assessors to be the total taxable value of land and additions on the property. | Land | Improvement |
|---|---|---|---|---|
| 2025 | $6,686 | $826,500 | $545,000 | $281,500 |
| 2024 | $6,686 | $796,700 | $525,000 | $271,700 |
| 2023 | $7,111 | $923,900 | $610,000 | $313,900 |
| 2022 | $6,094 | $632,500 | $366,000 | $266,500 |
| 2020 | $5,620 | $542,600 | $296,000 | $246,600 |
| 2019 | $4,951 | $489,300 | $245,000 | $244,300 |
| 2018 | $4,647 | $433,000 | $215,000 | $218,000 |
| 2017 | $3,984 | $381,100 | $178,000 | $203,100 |
| 2016 | $3,853 | $357,000 | $160,000 | $197,000 |
Source: Public Records
Map
Nearby Homes
- 20029 7th Ave SE
- 820 Grimes Rd
- 727 198th Place SE
- 429 203rd Place SE
- 19921 10th Dr SE
- 20224 11th Dr SE
- 20511 Greening Rd
- 1126 199th St SE
- 19726 Filbert Dr
- 1216 199th St SE
- 24 199th Place SE
- 105 202nd St SE
- 603 194th Place SE
- 309 207th Place SE
- 300 208th St SE
- 20318 Bothell Everett Hwy Unit A303
- 1402 194th St SE Unit 1
- 1322 194th St SE Unit B4
- 1322 194th St SE Unit B7
- 1322 194th St SE Unit B2
- 20107 7th Ave SE
- 20101 7th Ave SE
- 20111 7th Ave SE
- 19917 7th Ave SE
- 20105 8th Dr SE
- 16932 7th Ave SE
- 16819 8th Dr SE
- 16933 8th Dr SE
- 16815 7th Ave SE
- 20105 6th Dr SE
- 20115 7th Ave SE
- 20019 8th Dr SE
- 20031 6th Dr SE
- 20027 6th Dr SE
- 20123 7th Ave SE
- 706 Harvest Rd
- 20015 8th Dr SE
- 20023 6th Dr SE
- 20120 6th Dr SE
- 20116 6th Dr SE
Your Personal Tour Guide
Ask me questions while you tour the home.