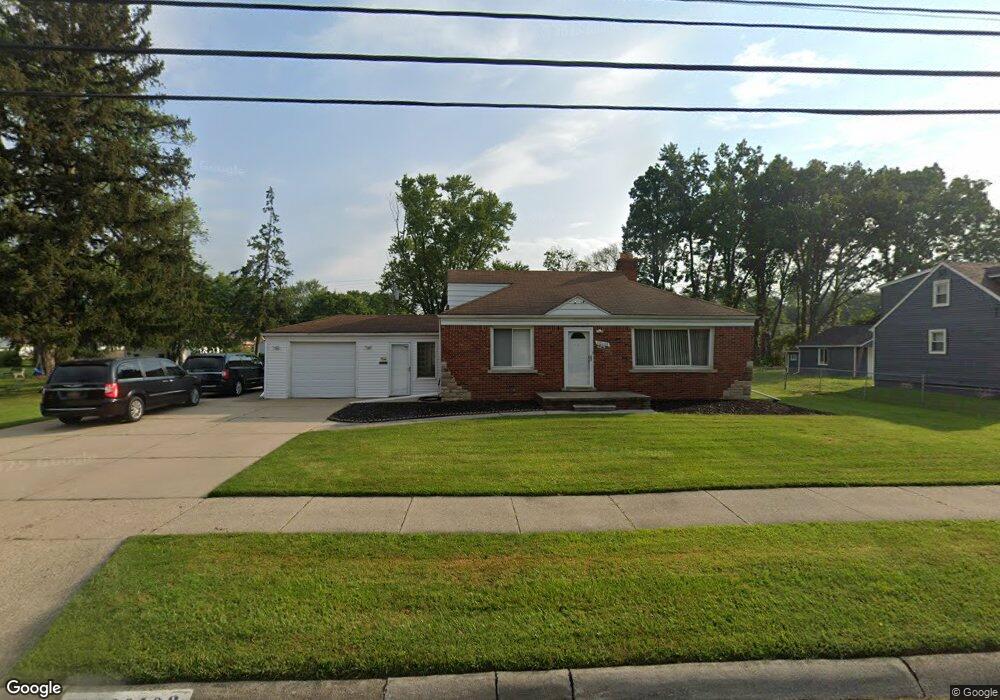
20103 Huntington Ave Harper Woods, MI 48225
Estimated Value: $186,000 - $222,904
--
Bed
1
Bath
1,183
Sq Ft
$176/Sq Ft
Est. Value
About This Home
This home is located at 20103 Huntington Ave, Harper Woods, MI 48225 and is currently estimated at $208,476, approximately $176 per square foot. 20103 Huntington Ave is a home located in Wayne County with nearby schools including Beacon Elementary School, Tyrone Elementary School, and Harper Woods Middle School.
Ownership History
Date
Name
Owned For
Owner Type
Purchase Details
Closed on
Oct 21, 2005
Sold by
Springs Brenda Lee
Bought by
Springs Quentin
Current Estimated Value
Home Financials for this Owner
Home Financials are based on the most recent Mortgage that was taken out on this home.
Original Mortgage
$110,680
Outstanding Balance
$60,060
Interest Rate
5.98%
Mortgage Type
Fannie Mae Freddie Mac
Estimated Equity
$148,416
Purchase Details
Closed on
Sep 15, 2005
Sold by
Springs Brenda L
Bought by
Springs Brenda L
Home Financials for this Owner
Home Financials are based on the most recent Mortgage that was taken out on this home.
Original Mortgage
$110,680
Outstanding Balance
$60,060
Interest Rate
5.98%
Mortgage Type
Fannie Mae Freddie Mac
Estimated Equity
$148,416
Purchase Details
Closed on
Mar 21, 2002
Sold by
Lombardo Nancy C
Bought by
Springs Brenda L
Create a Home Valuation Report for This Property
The Home Valuation Report is an in-depth analysis detailing your home's value as well as a comparison with similar homes in the area
Home Values in the Area
Average Home Value in this Area
Purchase History
| Date | Buyer | Sale Price | Title Company |
|---|---|---|---|
| Springs Quentin | -- | First American Title Ins Co | |
| Springs Brenda L | -- | None Available | |
| Springs Brenda L | $148,000 | -- |
Source: Public Records
Mortgage History
| Date | Status | Borrower | Loan Amount |
|---|---|---|---|
| Open | Springs Quentin | $110,680 |
Source: Public Records
Tax History Compared to Growth
Tax History
| Year | Tax Paid | Tax Assessment Tax Assessment Total Assessment is a certain percentage of the fair market value that is determined by local assessors to be the total taxable value of land and additions on the property. | Land | Improvement |
|---|---|---|---|---|
| 2025 | $1,403 | $86,500 | $0 | $0 |
| 2024 | $1,403 | $81,900 | $0 | $0 |
| 2023 | $1,338 | $70,900 | $0 | $0 |
| 2022 | $2,966 | $64,100 | $0 | $0 |
| 2021 | $2,862 | $57,800 | $0 | $0 |
| 2019 | $2,801 | $45,900 | $0 | $0 |
| 2018 | $1,040 | $38,900 | $0 | $0 |
| 2017 | $3,035 | $38,900 | $0 | $0 |
| 2016 | $2,623 | $39,400 | $0 | $0 |
| 2015 | $2,925 | $35,500 | $0 | $0 |
| 2013 | $2,820 | $28,200 | $0 | $0 |
| 2012 | $748 | $32,600 | $18,600 | $14,000 |
Source: Public Records
Map
Nearby Homes
- 19926 Damman St
- 19726 Eastwood Dr
- 20202 Hunt Club Dr
- 20522 Woodmont St
- 19780 Beaconsfield St
- 19711 Damman St
- 19645 Woodmont St
- 20006 Lochmoor St
- 20432 Hunt Club Dr
- 20611 Damman St
- 20602 Kenmore Ave
- 19685 Lochmoor St
- 20696 Huntington Ave
- 20506 Lochmoor St
- 19945 Woodside St
- 20251 Country Club Dr
- 20048 Woodside St
- 20260 Lancaster St
- 20490 Country Club Dr
- 19420 Woodmont St
- 20028 Woodmont St
- 20020 Woodmont St
- 20012 Woodmont St
- 20002 Woodmont St
- 20204 Woodmont St
- 20217 Huntington Ave
- 19994 Woodmont St
- 19995 Huntington Ave
- 20218 Woodmont St
- 19986 Woodmont St
- 20050 Huntington Ave
- 20158 Huntington Ave
- 20226 Woodmont St
- 20234 Woodmont St
- 19978 Woodmont St
- 19970 Woodmont St
- 20242 Woodmont St
- 20218 Huntington Ave
- 20100 Huntington Ave
- 19996 Huntington Ave