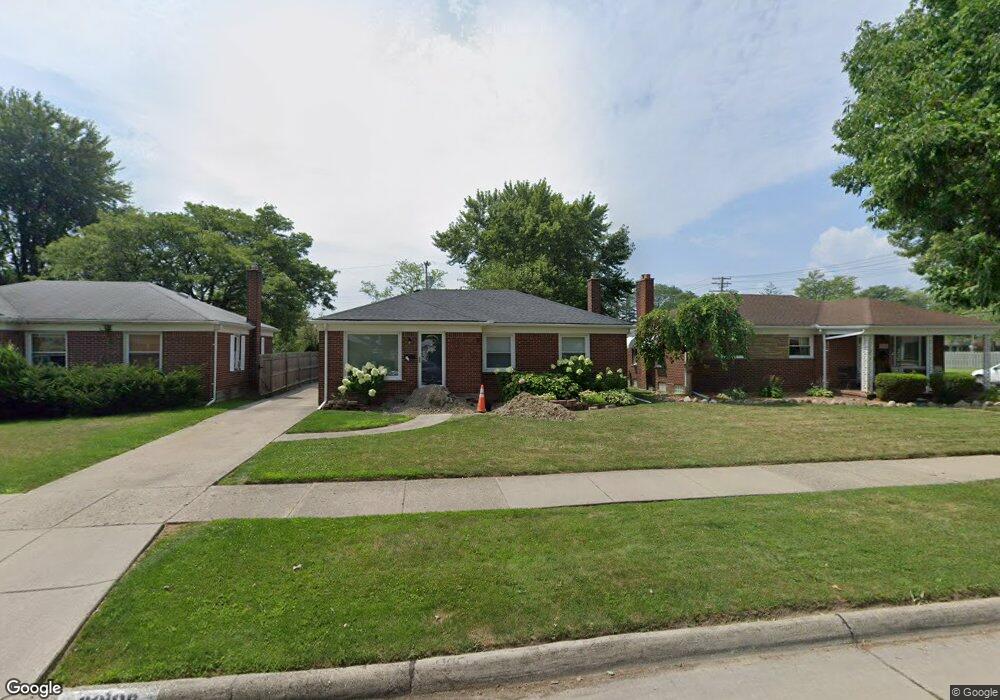
20106 Elizabeth St Unit Bldg-Unit Saint Clair Shores, MI 48080
Estimated Value: $239,000 - $286,000
3
Beds
2
Baths
1,003
Sq Ft
$262/Sq Ft
Est. Value
About This Home
This home is located at 20106 Elizabeth St Unit Bldg-Unit, Saint Clair Shores, MI 48080 and is currently estimated at $263,131, approximately $262 per square foot. 20106 Elizabeth St Unit Bldg-Unit is a home located in Macomb County with nearby schools including South Lake Middle School, South Lake High School, and St. Joan of Arc Elementary School.
Ownership History
Date
Name
Owned For
Owner Type
Purchase Details
Closed on
Jul 16, 2018
Sold by
Plannett Michael C
Bought by
Hoskins Scott and Hoskins Jodi
Current Estimated Value
Purchase Details
Closed on
Oct 21, 2015
Sold by
Dobrzechowski James and Dobrzechowski Amy
Bought by
Plannett Michael C
Purchase Details
Closed on
Mar 31, 2000
Sold by
Susan Robert D
Bought by
Dobrzechowski James
Home Financials for this Owner
Home Financials are based on the most recent Mortgage that was taken out on this home.
Original Mortgage
$13,000
Interest Rate
8.18%
Purchase Details
Closed on
Oct 31, 1994
Sold by
Charles Miranti Est
Bought by
Robert D and Robert Susan Peggy
Home Financials for this Owner
Home Financials are based on the most recent Mortgage that was taken out on this home.
Original Mortgage
$52,000
Interest Rate
7%
Mortgage Type
New Conventional
Create a Home Valuation Report for This Property
The Home Valuation Report is an in-depth analysis detailing your home's value as well as a comparison with similar homes in the area
Home Values in the Area
Average Home Value in this Area
Purchase History
| Date | Buyer | Sale Price | Title Company |
|---|---|---|---|
| Hoskins Scott | $188,000 | None Available | |
| Plannett Michael C | $113,000 | Greco Title Agency Llc | |
| Dobrzechowski James | $130,000 | -- | |
| Robert D | $65,000 | -- |
Source: Public Records
Mortgage History
| Date | Status | Borrower | Loan Amount |
|---|---|---|---|
| Previous Owner | Dobrzechowski James | $13,000 | |
| Previous Owner | Robert D | $52,000 |
Source: Public Records
Tax History Compared to Growth
Tax History
| Year | Tax Paid | Tax Assessment Tax Assessment Total Assessment is a certain percentage of the fair market value that is determined by local assessors to be the total taxable value of land and additions on the property. | Land | Improvement |
|---|---|---|---|---|
| 2025 | $4,463 | $115,600 | $0 | $0 |
| 2024 | $4,330 | $111,500 | $0 | $0 |
| 2023 | $4,123 | $99,900 | $0 | $0 |
| 2022 | $3,945 | $91,300 | $0 | $0 |
| 2021 | $4,130 | $83,300 | $0 | $0 |
| 2020 | $4,030 | $82,600 | $0 | $0 |
| 2019 | $3,959 | $74,100 | $0 | $0 |
| 2018 | $2,592 | $52,200 | $0 | $0 |
| 2017 | $2,592 | $48,400 | $7,900 | $40,500 |
| 2016 | $2,405 | $48,400 | $0 | $0 |
| 2015 | $1,861 | $42,600 | $0 | $0 |
| 2013 | -- | $35,700 | $0 | $0 |
| 2012 | -- | $37,400 | $7,200 | $30,200 |
Source: Public Records
Map
Nearby Homes
- 22843 Grove St Unit 47
- 22859 Grove St Unit 53
- 20615 California St
- 19916 Alger St
- 20707 Elizabeth St
- 19709 Gaukler St
- 20690 California St
- 19813 Rosedale St
- 19612 Gaukler St
- 20608 Rosedale St
- 22533 Raven Ave
- 20505 Shady Lane Ave
- 20618 Sunnyside St
- 20308 Shady Lane Ave
- 21715 Alger St
- 20406 Mauer St
- 22444 Kelly Rd Unit 11
- 19000 Rosetta Ave
- 20025 Chalon St
- 20400 Edmunton St
- 20106 Elizabeth St
- 20112 Elizabeth St
- 20100 Elizabeth St
- 20118 Elizabeth St
- 20124 Elizabeth St
- 22515 Pallister St
- 20200 Elizabeth St
- 20201 Maxine St
- 20101 Maxine St
- 22600 Pallister St
- 20111 Elizabeth St
- 20119 Elizabeth St
- 20206 Elizabeth St
- 20021 Maxine St
- 20021 Elizabeth St
- 20125 Elizabeth St
- 20113 Maxine St
- 20006 Elizabeth St
- 20015 Elizabeth St
- 20212 Elizabeth St