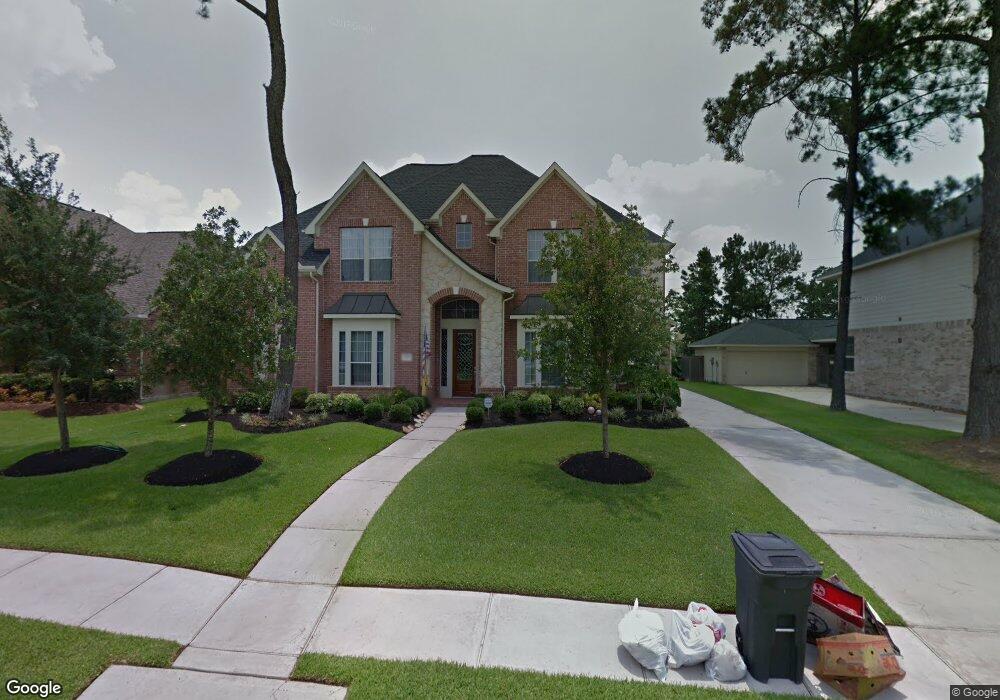
20107 Standing Cypress Dr Spring, TX 77379
Gleannloch Farms NeighborhoodEstimated Value: $528,000 - $638,000
4
Beds
4
Baths
4,008
Sq Ft
$148/Sq Ft
Est. Value
About This Home
This home is located at 20107 Standing Cypress Dr, Spring, TX 77379 and is currently estimated at $591,340, approximately $147 per square foot. 20107 Standing Cypress Dr is a home located in Harris County with nearby schools including Frank Elementary School, Doerre Intermediate School, and Klein Cain High School.
Ownership History
Date
Name
Owned For
Owner Type
Purchase Details
Closed on
Aug 29, 2014
Sold by
Zeiler Marilyn Hilborn and Hobbbs Marilyn
Bought by
Rouse Richard S and Rouse Julie C
Current Estimated Value
Home Financials for this Owner
Home Financials are based on the most recent Mortgage that was taken out on this home.
Original Mortgage
$405,000
Outstanding Balance
$310,169
Interest Rate
4.15%
Mortgage Type
New Conventional
Estimated Equity
$281,171
Purchase Details
Closed on
Aug 29, 2007
Sold by
Trendmaker Homes Inc
Bought by
Zeiler Marilyn Hilborn
Home Financials for this Owner
Home Financials are based on the most recent Mortgage that was taken out on this home.
Original Mortgage
$346,203
Interest Rate
6.72%
Mortgage Type
Purchase Money Mortgage
Create a Home Valuation Report for This Property
The Home Valuation Report is an in-depth analysis detailing your home's value as well as a comparison with similar homes in the area
Home Values in the Area
Average Home Value in this Area
Purchase History
| Date | Buyer | Sale Price | Title Company |
|---|---|---|---|
| Rouse Richard S | -- | Capital Title | |
| Zeiler Marilyn Hilborn | -- | Chicago Title |
Source: Public Records
Mortgage History
| Date | Status | Borrower | Loan Amount |
|---|---|---|---|
| Open | Rouse Richard S | $405,000 | |
| Previous Owner | Zeiler Marilyn Hilborn | $346,203 |
Source: Public Records
Tax History
| Year | Tax Paid | Tax Assessment Tax Assessment Total Assessment is a certain percentage of the fair market value that is determined by local assessors to be the total taxable value of land and additions on the property. | Land | Improvement |
|---|---|---|---|---|
| 2025 | $6,833 | $547,056 | $93,354 | $453,702 |
| 2024 | $6,833 | $554,369 | $75,139 | $479,230 |
| 2023 | $6,833 | $560,242 | $75,139 | $485,103 |
| 2022 | $11,827 | $526,260 | $71,040 | $455,220 |
| 2021 | $11,498 | $420,937 | $71,040 | $349,897 |
| 2020 | $11,993 | $413,734 | $71,040 | $342,694 |
| 2019 | $12,607 | $419,045 | $71,040 | $348,005 |
| 2018 | $5,004 | $403,203 | $71,040 | $332,163 |
| 2017 | $12,229 | $403,203 | $71,040 | $332,163 |
| 2016 | $12,229 | $403,203 | $71,040 | $332,163 |
| 2015 | $10,275 | $403,203 | $71,040 | $332,163 |
| 2014 | $10,275 | $368,000 | $71,040 | $296,960 |
Source: Public Records
Map
Nearby Homes
- 1629 Grable Cove Ln
- 1651 Grable Cove Ln
- 20019 Standing Cypress Dr
- 1618 Grable Cove Ln
- 10510 Day Trail Ln
- 9822 Prairie Clover Ln
- 10606 Steppinstone Ct
- 10410 Kilbride Way Ct
- 19902 Tidy Tips Ln
- 1211 Wealden Forest Dr
- 20008 Champion Forest Dr Unit 1001
- 1207 Walston Ridge Dr
- 20310 Dark Hollow Ln
- 20314 Dark Hollow Ln
- 19907 Ogdenburg Falls Dr
- 19622 Candlewood Oaks Ln
- 19222 Danphe Landing Ct
- 19218 Danphe Landing Ct
- 9535 Empress Crossing Dr
- 9935 Kirkstone Terrace Dr
- 20103 Standing Cypress Dr
- 20111 Standing Cypress Dr
- 20039 Standing Cypress Dr
- 20102 Standing Cypress Dr
- 20106 Standing Cypress Dr
- 20035 Standing Cypress Dr
- 20110 Standing Cypress Dr
- 9943 Rollinson Park Dr
- 20118 Standing Cypress Dr
- 20114 Standing Cypress Dr
- 20031 Standing Cypress Dr
- 20122 Standing Cypress Dr
- 20107 Sweet William Ct
- 9939 Rollinson Park Dr
- 20030 Standing Cypress Dr
- 20103 Sweet William Ct
- 1639 Grable Cove Ln
- 1641 Grable Cove Ln
- 1637 Grable Cove Ln
- 1635 Grable Cove Ln
Your Personal Tour Guide
Ask me questions while you tour the home.