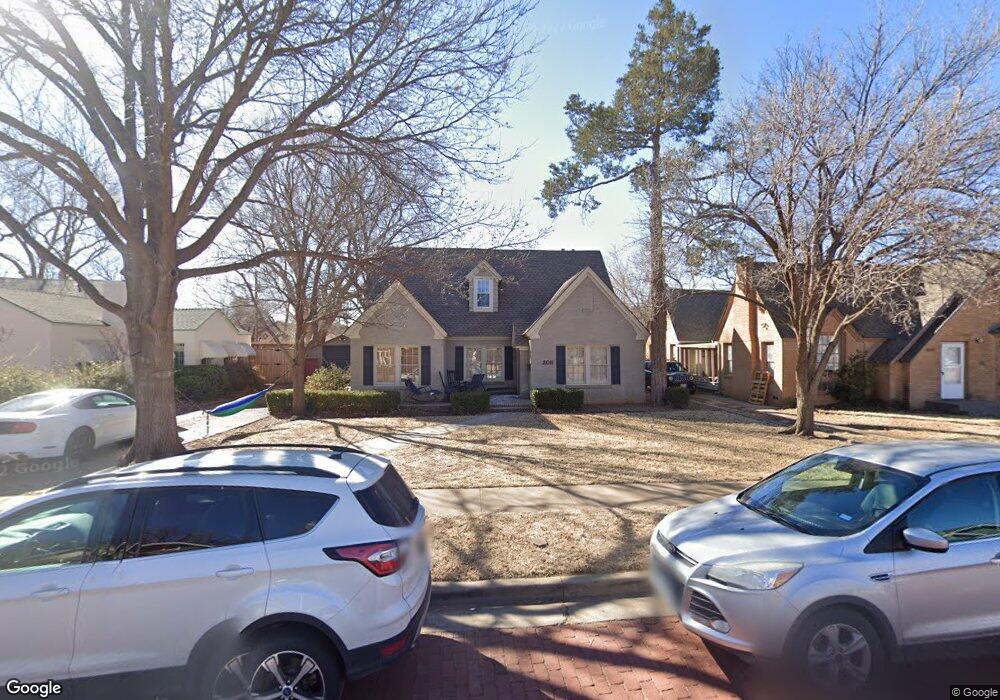
2011 16th St Lubbock, TX 79401
South Overton NeighborhoodEstimated Value: $179,000 - $295,200
3
Beds
2
Baths
2,333
Sq Ft
$106/Sq Ft
Est. Value
About This Home
This home is located at 2011 16th St, Lubbock, TX 79401 and is currently estimated at $248,050, approximately $106 per square foot. 2011 16th St is a home located in Lubbock County with nearby schools including Ramirez Elementary School, Hutchinson Middle School, and Lubbock High School.
Ownership History
Date
Name
Owned For
Owner Type
Purchase Details
Closed on
Apr 14, 2017
Sold by
Scatt Mangement Llc
Bought by
Sactt 2011 Lubbock Llc
Current Estimated Value
Purchase Details
Closed on
Jan 25, 2017
Sold by
Wencl John William and Wencl Jeannine Marie
Bought by
Scatt Management Llc
Purchase Details
Closed on
Aug 26, 2015
Sold by
Hickman Justin L and Johnson Marla L
Bought by
Wencl John William and Wencl Jeannine Marie
Home Financials for this Owner
Home Financials are based on the most recent Mortgage that was taken out on this home.
Original Mortgage
$108,000
Interest Rate
4.08%
Mortgage Type
New Conventional
Create a Home Valuation Report for This Property
The Home Valuation Report is an in-depth analysis detailing your home's value as well as a comparison with similar homes in the area
Home Values in the Area
Average Home Value in this Area
Purchase History
| Date | Buyer | Sale Price | Title Company |
|---|---|---|---|
| Sactt 2011 Lubbock Llc | -- | None Available | |
| Scatt Management Llc | -- | None Available | |
| Wencl John William | $108,000 | Service Title |
Source: Public Records
Mortgage History
| Date | Status | Borrower | Loan Amount |
|---|---|---|---|
| Previous Owner | Wencl John William | $108,000 |
Source: Public Records
Tax History
| Year | Tax Paid | Tax Assessment Tax Assessment Total Assessment is a certain percentage of the fair market value that is determined by local assessors to be the total taxable value of land and additions on the property. | Land | Improvement |
|---|---|---|---|---|
| 2025 | $3,942 | $217,095 | $22,600 | $194,495 |
| 2024 | $39 | $217,095 | $22,600 | $194,495 |
| 2023 | $4,822 | $259,398 | $8,640 | $250,758 |
| 2022 | $5,251 | $259,398 | $8,640 | $250,758 |
| 2021 | $4,855 | $226,676 | $8,640 | $218,036 |
| 2020 | $4,997 | $229,790 | $8,640 | $221,150 |
| 2019 | $4,222 | $188,053 | $8,640 | $179,413 |
| 2018 | $3,291 | $146,406 | $8,640 | $137,766 |
| 2017 | $2,846 | $126,439 | $8,640 | $117,799 |
| 2016 | $2,882 | $128,030 | $8,640 | $119,390 |
| 2015 | $2,751 | $127,301 | $8,640 | $118,661 |
| 2014 | $2,751 | $123,708 | $2,560 | $121,148 |
Source: Public Records
Map
Nearby Homes
Your Personal Tour Guide
Ask me questions while you tour the home.