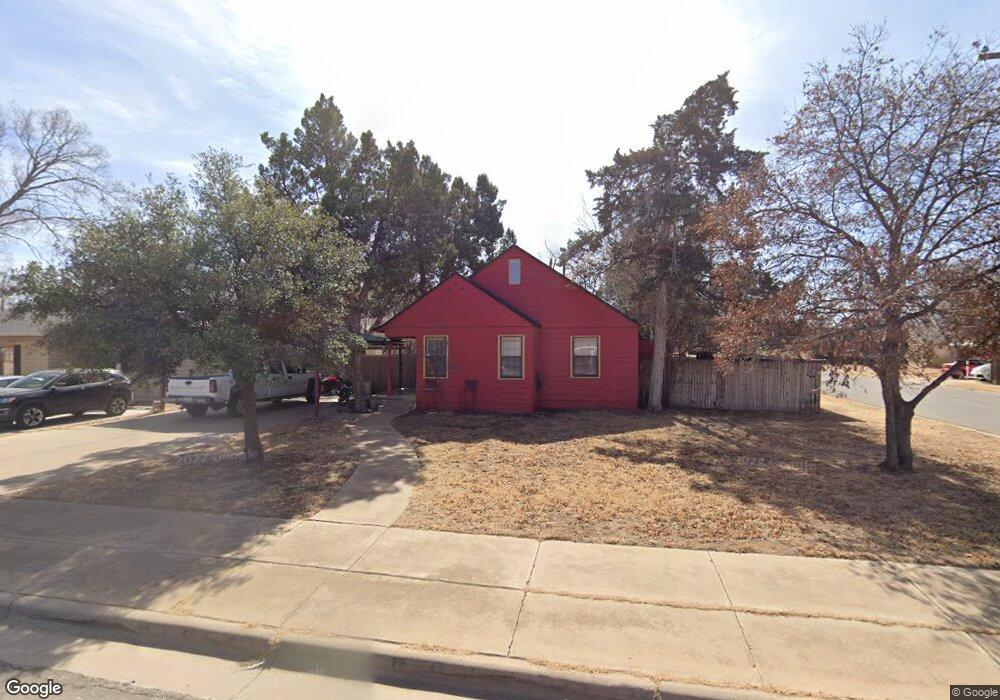
2011 31st St Unit REAR Lubbock, TX 79411
Heart of Lubbock NeighborhoodEstimated Value: $136,662 - $146,000
1
Bed
1
Bath
600
Sq Ft
$236/Sq Ft
Est. Value
About This Home
This home is located at 2011 31st St Unit REAR, Lubbock, TX 79411 and is currently estimated at $141,666, approximately $236 per square foot. 2011 31st St Unit REAR is a home located in Lubbock County with nearby schools including Dupre Elementary School, Brown Elementary School, and Slaton Middle School.
Ownership History
Date
Name
Owned For
Owner Type
Purchase Details
Closed on
Jul 9, 2015
Sold by
Murray Matt
Bought by
Ninety Five Llc
Current Estimated Value
Purchase Details
Closed on
Jun 5, 2013
Sold by
Walker William Thomas
Bought by
Davis Jacqueline Ann
Purchase Details
Closed on
May 17, 2012
Sold by
Ghlds #5 Llc
Bought by
Ninety Five Llc
Purchase Details
Closed on
Aug 15, 2011
Sold by
Gill Holdings L C
Bought by
Ghlds #5 Llc
Purchase Details
Closed on
Aug 31, 2006
Sold by
Gill Rajeev
Bought by
Gill Holdings Lc
Create a Home Valuation Report for This Property
The Home Valuation Report is an in-depth analysis detailing your home's value as well as a comparison with similar homes in the area
Home Values in the Area
Average Home Value in this Area
Purchase History
| Date | Buyer | Sale Price | Title Company |
|---|---|---|---|
| Ninety Five Llc | -- | -- | |
| Davis Jacqueline Ann | -- | None Available | |
| Ninety Five Llc | -- | -- | |
| Ghlds #5 Llc | -- | None Available | |
| Gill Holdings Lc | -- | None Available |
Source: Public Records
Tax History Compared to Growth
Tax History
| Year | Tax Paid | Tax Assessment Tax Assessment Total Assessment is a certain percentage of the fair market value that is determined by local assessors to be the total taxable value of land and additions on the property. | Land | Improvement |
|---|---|---|---|---|
| 2025 | $2,798 | $141,953 | $25,000 | $116,953 |
| 2024 | $2,798 | $154,096 | $25,000 | $129,096 |
| 2023 | $2,496 | $134,278 | $20,830 | $113,448 |
| 2022 | $2,547 | $125,802 | $20,830 | $104,972 |
| 2021 | $2,223 | $103,812 | $20,830 | $82,982 |
| 2020 | $2,286 | $105,109 | $20,830 | $84,279 |
| 2019 | $2,069 | $92,143 | $20,830 | $71,313 |
| 2018 | $2,013 | $89,543 | $20,830 | $68,713 |
| 2017 | $1,708 | $75,897 | $4,197 | $71,700 |
| 2016 | $1,717 | $76,270 | $4,197 | $72,073 |
| 2015 | $1,723 | $74,652 | $4,197 | $70,455 |
| 2014 | $1,723 | $77,488 | $4,197 | $73,291 |
Source: Public Records
Map
Nearby Homes