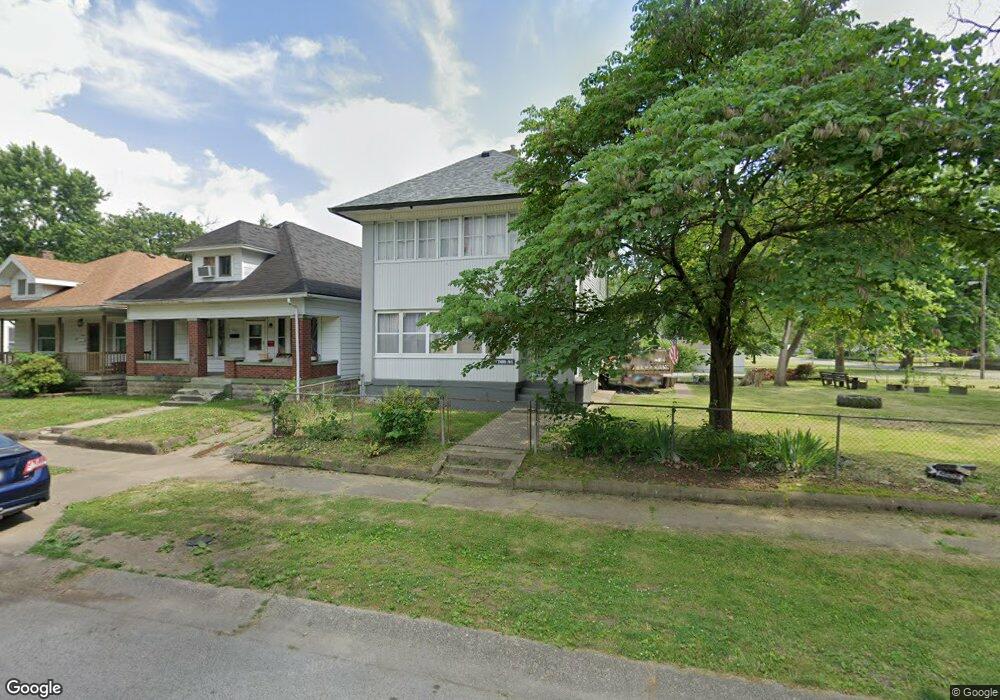
2011 3rd Ave Unit 2037 Terre Haute, IN 47807
The Avenues NeighborhoodEstimated Value: $57,000 - $100,464
3
Beds
1
Bath
1,380
Sq Ft
$56/Sq Ft
Est. Value
About This Home
This home is located at 2011 3rd Ave Unit 2037, Terre Haute, IN 47807 and is currently estimated at $77,821, approximately $56 per square foot. 2011 3rd Ave Unit 2037 is a home located in Vigo County with nearby schools including Benjamin Franklin Elementary School, Woodrow Wilson Middle School, and Terre Haute North Vigo High School.
Ownership History
Date
Name
Owned For
Owner Type
Purchase Details
Closed on
Feb 15, 2022
Sold by
Burris Bradley A
Bought by
Wheeler Kevin
Current Estimated Value
Purchase Details
Closed on
Dec 28, 2012
Sold by
Smith Joseph M
Bought by
Burris Bradley A
Home Financials for this Owner
Home Financials are based on the most recent Mortgage that was taken out on this home.
Original Mortgage
$21,675
Interest Rate
4%
Mortgage Type
Adjustable Rate Mortgage/ARM
Purchase Details
Closed on
Oct 16, 2008
Sold by
Gingerbread House Designs Inc
Bought by
First Financial Bank Na
Create a Home Valuation Report for This Property
The Home Valuation Report is an in-depth analysis detailing your home's value as well as a comparison with similar homes in the area
Home Values in the Area
Average Home Value in this Area
Purchase History
| Date | Buyer | Sale Price | Title Company |
|---|---|---|---|
| Wheeler Kevin | $52,000 | Hendrich Title Company | |
| Burris Bradley A | -- | None Available | |
| First Financial Bank Na | -- | -- |
Source: Public Records
Mortgage History
| Date | Status | Borrower | Loan Amount |
|---|---|---|---|
| Previous Owner | Burris Bradley A | $21,675 |
Source: Public Records
Tax History
| Year | Tax Paid | Tax Assessment Tax Assessment Total Assessment is a certain percentage of the fair market value that is determined by local assessors to be the total taxable value of land and additions on the property. | Land | Improvement |
|---|---|---|---|---|
| 2025 | $832 | $98,300 | $4,900 | $93,400 |
| 2024 | $832 | $80,000 | $4,900 | $75,100 |
| 2023 | $818 | $76,300 | $4,900 | $71,400 |
| 2022 | $716 | $70,300 | $4,900 | $65,400 |
| 2021 | $704 | $65,300 | $5,600 | $59,700 |
| 2020 | $690 | $64,000 | $5,400 | $58,600 |
| 2019 | $677 | $62,800 | $5,200 | $57,600 |
| 2018 | $899 | $57,300 | $4,800 | $52,500 |
| 2017 | $588 | $56,200 | $4,700 | $51,500 |
| 2016 | $588 | $56,200 | $4,700 | $51,500 |
| 2014 | $567 | $54,500 | $4,700 | $49,800 |
| 2013 | $567 | $53,300 | $4,500 | $48,800 |
Source: Public Records
Map
Nearby Homes
Your Personal Tour Guide
Ask me questions while you tour the home.