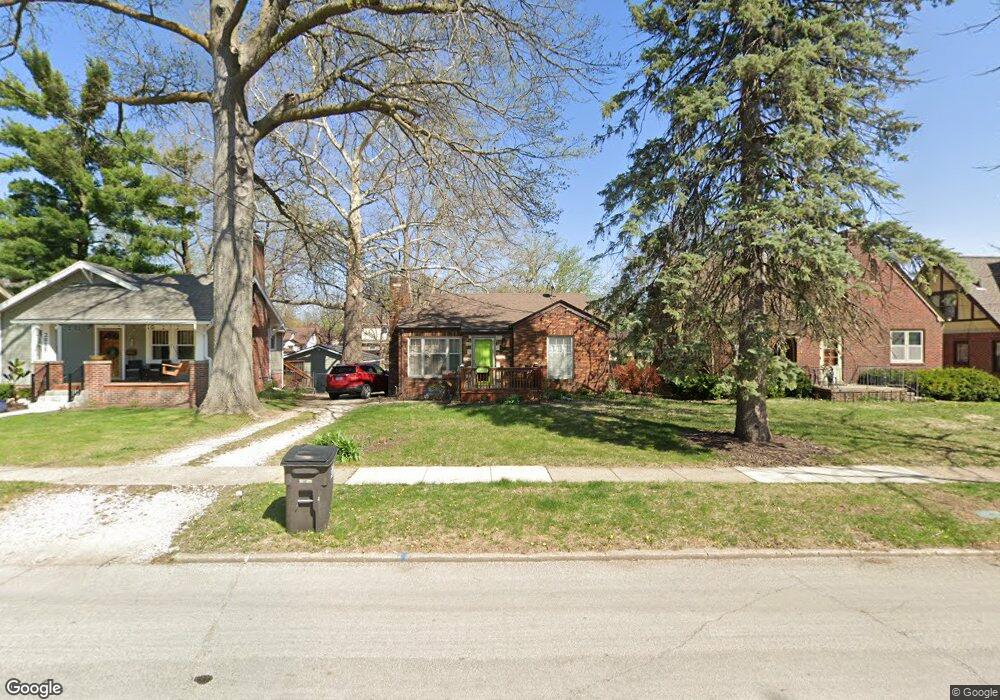
2011 40th Place Des Moines, IA 50310
Beaverdale NeighborhoodEstimated Value: $189,723 - $207,000
2
Beds
1
Bath
741
Sq Ft
$270/Sq Ft
Est. Value
About This Home
This home is located at 2011 40th Place, Des Moines, IA 50310 and is currently estimated at $200,181, approximately $270 per square foot. 2011 40th Place is a home located in Polk County with nearby schools including Perkins Elementary School, Merrill Middle School, and Roosevelt High School.
Ownership History
Date
Name
Owned For
Owner Type
Purchase Details
Closed on
Feb 27, 2008
Sold by
Morkin Vandyke Eric Jon and Morkin Dyke Karen June
Bought by
Dalbey Marilyn E
Current Estimated Value
Home Financials for this Owner
Home Financials are based on the most recent Mortgage that was taken out on this home.
Original Mortgage
$109,900
Outstanding Balance
$68,190
Interest Rate
5.75%
Mortgage Type
Purchase Money Mortgage
Estimated Equity
$131,991
Purchase Details
Closed on
Feb 5, 1999
Sold by
Bernson Mara and Vandyke Mara B
Bought by
Vandyke Eric Jon
Create a Home Valuation Report for This Property
The Home Valuation Report is an in-depth analysis detailing your home's value as well as a comparison with similar homes in the area
Home Values in the Area
Average Home Value in this Area
Purchase History
We collect this data history from publicly available records. To have your information removed, we recommend requesting removal directly through your county’s website.
| Date | Buyer | Sale Price | Title Company |
|---|---|---|---|
| Dalbey Marilyn E | $109,500 | Itc | |
| Vandyke Eric Jon | -- | -- |
Source: Public Records
Mortgage History
We collect this data history from publicly available records. To have your information removed, we recommend requesting removal directly through your county’s website.
| Date | Status | Borrower | Loan Amount |
|---|---|---|---|
| Open | Dalbey Marilyn E | $109,900 |
Source: Public Records
Tax History
| Year | Tax Paid | Tax Assessment Tax Assessment Total Assessment is a certain percentage of the fair market value that is determined by local assessors to be the total taxable value of land and additions on the property. | Land | Improvement |
|---|---|---|---|---|
| 2025 | $3,078 | $190,300 | $45,600 | $144,700 |
| 2024 | $3,078 | $173,900 | $41,000 | $132,900 |
| 2023 | $3,340 | $173,900 | $41,000 | $132,900 |
| 2022 | $3,312 | $150,600 | $36,200 | $114,400 |
| 2021 | $3,250 | $150,600 | $36,200 | $114,400 |
| 2020 | $3,370 | $138,800 | $33,100 | $105,700 |
| 2019 | $3,146 | $138,800 | $33,100 | $105,700 |
| 2018 | $3,110 | $125,600 | $29,500 | $96,100 |
| 2017 | $2,798 | $125,600 | $29,500 | $96,100 |
| 2016 | $2,722 | $112,000 | $25,800 | $86,200 |
| 2015 | $2,722 | $112,000 | $25,800 | $86,200 |
| 2014 | $2,434 | $104,000 | $23,600 | $80,400 |
Source: Public Records
Map
Nearby Homes
- 4635 173rd St
- 4643 173rd St
- 2009 Beaver Ave
- 2121 40th Place
- 2014 39th St
- 2207 Beaver Ave
- 1742 Marella Trail
- 4209 Allison Ave
- 4212 Allison Ave
- 2208 38th St
- 4217 Franklin Ave
- 1733 Northwest Dr
- 1655 Beaver Ave
- 4122 Northwest Dr
- 1711 Northwest Dr
- 1647 Beaver Ave
- 1728 Northwest Dr
- 1652 Beaver Ave
- 4300 Holland Dr
- 1637 Huntland Dr
Your Personal Tour Guide
Ask me questions while you tour the home.