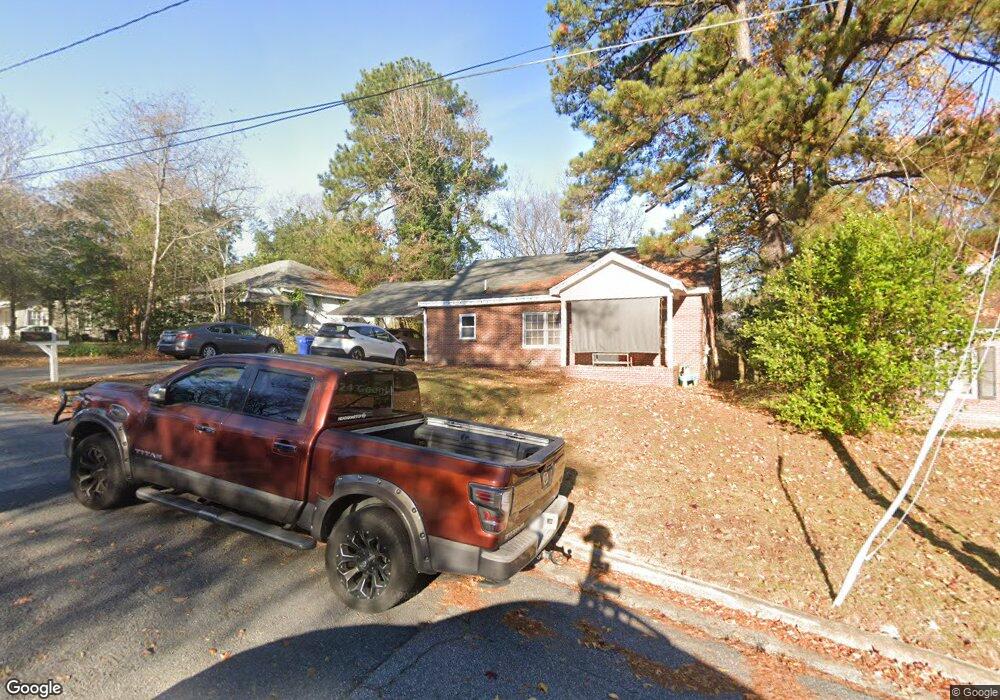
2011 43rd St Columbus, GA 31904
North Columbus NeighborhoodEstimated Value: $177,000 - $198,000
4
Beds
2
Baths
1,773
Sq Ft
$104/Sq Ft
Est. Value
About This Home
This home is located at 2011 43rd St, Columbus, GA 31904 and is currently estimated at $183,882, approximately $103 per square foot. 2011 43rd St is a home located in Muscogee County with nearby schools including Johnson Elementary School, Richards Middle School, and Jordan Vocational High School.
Ownership History
Date
Name
Owned For
Owner Type
Purchase Details
Closed on
Oct 12, 2016
Sold by
Rulon Benjamin
Bought by
Silvis Scott D and Silvis Jessica E
Current Estimated Value
Home Financials for this Owner
Home Financials are based on the most recent Mortgage that was taken out on this home.
Original Mortgage
$104,080
Outstanding Balance
$83,545
Interest Rate
3.5%
Mortgage Type
FHA
Estimated Equity
$100,337
Purchase Details
Closed on
Apr 5, 2010
Sold by
Deal Dennis R
Bought by
Rulon Benjamin
Home Financials for this Owner
Home Financials are based on the most recent Mortgage that was taken out on this home.
Original Mortgage
$113,451
Interest Rate
4.75%
Mortgage Type
FHA
Purchase Details
Closed on
Jun 2, 2008
Sold by
Rp Investment Group Llc
Bought by
Deal Dennis R
Create a Home Valuation Report for This Property
The Home Valuation Report is an in-depth analysis detailing your home's value as well as a comparison with similar homes in the area
Home Values in the Area
Average Home Value in this Area
Purchase History
| Date | Buyer | Sale Price | Title Company |
|---|---|---|---|
| Silvis Scott D | $106,000 | -- | |
| Rulon Benjamin | $121,500 | None Available | |
| Deal Dennis R | $70,000 | None Available | |
| Rp Investment Group Llc | $50,600 | None Available |
Source: Public Records
Mortgage History
| Date | Status | Borrower | Loan Amount |
|---|---|---|---|
| Open | Silvis Scott D | $104,080 | |
| Previous Owner | Rulon Benjamin | $113,451 |
Source: Public Records
Tax History
| Year | Tax Paid | Tax Assessment Tax Assessment Total Assessment is a certain percentage of the fair market value that is determined by local assessors to be the total taxable value of land and additions on the property. | Land | Improvement |
|---|---|---|---|---|
| 2025 | $2,222 | $56,764 | $8,004 | $48,760 |
| 2024 | $2,222 | $56,764 | $8,004 | $48,760 |
| 2023 | $2,236 | $56,764 | $8,004 | $48,760 |
| 2022 | $1,843 | $45,136 | $8,004 | $37,132 |
| 2021 | $1,707 | $41,796 | $8,004 | $33,792 |
| 2020 | $1,707 | $41,796 | $8,004 | $33,792 |
| 2019 | $1,712 | $41,796 | $8,004 | $33,792 |
| 2018 | $1,712 | $41,796 | $8,004 | $33,792 |
| 2017 | $1,743 | $42,400 | $7,960 | $34,440 |
| 2016 | $1,457 | $49,000 | $3,300 | $45,700 |
| 2015 | $1,460 | $49,000 | $3,300 | $45,700 |
| 2014 | $1,462 | $49,000 | $3,300 | $45,700 |
| 2013 | -- | $49,000 | $3,300 | $45,700 |
Source: Public Records
Map
Nearby Homes
- 4214 17th Ave
- 4526 19th Ave
- 2110 Terrace Dr
- 3905 Crestview Dr
- 4001 17th Ave
- 3640 Calvin Dr
- 4830 17th Ave
- 2322 Winchester Dr
- 4122 Acacia Dr
- 3618 17th Ave
- 4310 Acacia Dr
- 3600 23rd Ave
- 4212 Chalfonte Dr
- 2345 Gurley Dr
- 4125 Beallwood Ave
- 4303 Armour Rd
- 2257 Camille Dr
- 2369 Gurley Dr
- 1801 34th St
- 3425 17th Ave
Your Personal Tour Guide
Ask me questions while you tour the home.