2011 4th Ave Unit 13 Altoona, PA 16602
Sixth Ward NeighborhoodEstimated Value: $68,000 - $93,000
3
Beds
1
Bath
2,118
Sq Ft
$37/Sq Ft
Est. Value
About This Home
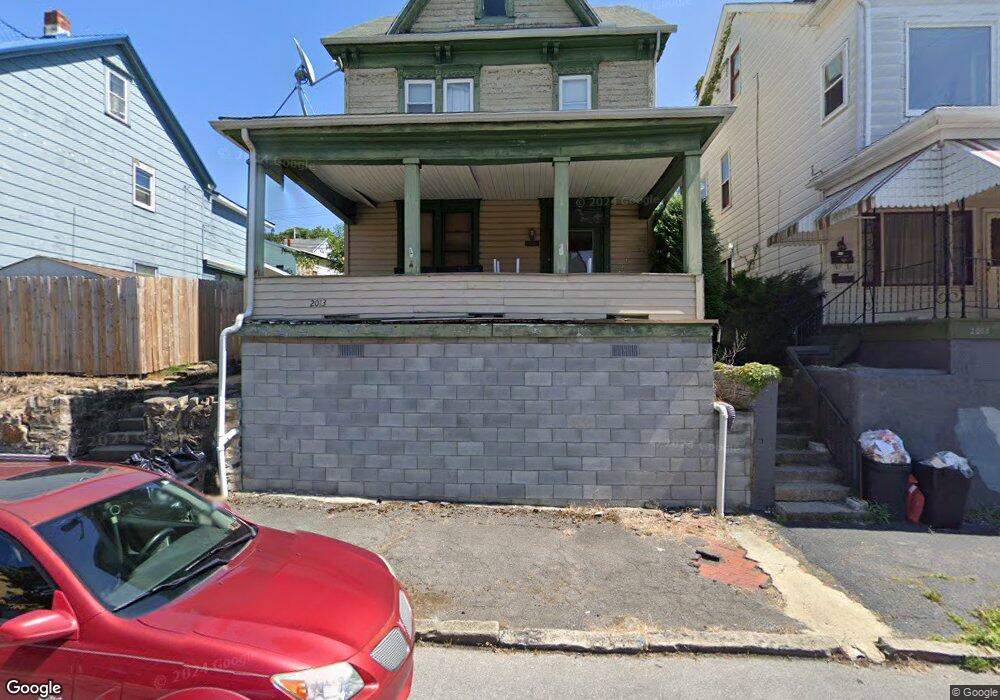
This home is located at 2011 4th Ave Unit 13, Altoona, PA 16602 and is currently estimated at $78,985, approximately $37 per square foot. 2011 4th Ave Unit 13 is a home located in Blair County with nearby schools including Bishop Guilfoyle Academy and Great Commission Schools.
Ownership History
Date
Name
Owned For
Owner Type
Purchase Details
Closed on
May 10, 2021
Sold by
Trout Lori and Koo Paul
Bought by
Nagle Nathaniel P
Current Estimated Value
Home Financials for this Owner
Home Financials are based on the most recent Mortgage that was taken out on this home.
Original Mortgage
$53,000
Outstanding Balance
$46,487
Interest Rate
3.1%
Mortgage Type
New Conventional
Estimated Equity
$32,498
Purchase Details
Closed on
Jul 12, 2016
Sold by
Roth David
Bought by
Trout Lori
Home Financials for this Owner
Home Financials are based on the most recent Mortgage that was taken out on this home.
Original Mortgage
$28,000
Interest Rate
4.75%
Mortgage Type
Adjustable Rate Mortgage/ARM
Purchase Details
Closed on
Jun 29, 2011
Sold by
Fannie Mae
Bought by
Roth David
Purchase Details
Closed on
Jun 7, 2011
Sold by
Frederick Jennifer L
Bought by
Federal National Mortgage Association
Create a Home Valuation Report for This Property
The Home Valuation Report is an in-depth analysis detailing your home's value as well as a comparison with similar homes in the area
Home Values in the Area
Average Home Value in this Area
Purchase History
| Date | Buyer | Sale Price | Title Company |
|---|---|---|---|
| Nagle Nathaniel P | $63,000 | None Available | |
| Trout Lori | $35,000 | None Available | |
| Roth David | $13,500 | None Available | |
| Federal National Mortgage Association | $1,500 | None Available |
Source: Public Records
Mortgage History
| Date | Status | Borrower | Loan Amount |
|---|---|---|---|
| Open | Nagle Nathaniel P | $53,000 | |
| Previous Owner | Trout Lori | $28,000 |
Source: Public Records
Tax History Compared to Growth
Tax History
| Year | Tax Paid | Tax Assessment Tax Assessment Total Assessment is a certain percentage of the fair market value that is determined by local assessors to be the total taxable value of land and additions on the property. | Land | Improvement |
|---|---|---|---|---|
| 2025 | $817 | $42,800 | $9,000 | $33,800 |
| 2024 | $723 | $42,800 | $9,000 | $33,800 |
| 2023 | $670 | $42,800 | $9,000 | $33,800 |
| 2022 | $660 | $42,800 | $9,000 | $33,800 |
| 2021 | $660 | $42,800 | $9,000 | $33,800 |
| 2020 | $659 | $42,800 | $9,000 | $33,800 |
| 2019 | $644 | $42,800 | $9,000 | $33,800 |
| 2018 | $626 | $42,800 | $9,000 | $33,800 |
| 2017 | $2,708 | $42,800 | $9,000 | $33,800 |
| 2016 | $165 | $5,150 | $600 | $4,550 |
| 2015 | $165 | $5,150 | $600 | $4,550 |
| 2014 | $165 | $5,150 | $600 | $4,550 |
Source: Public Records
Map
Nearby Homes