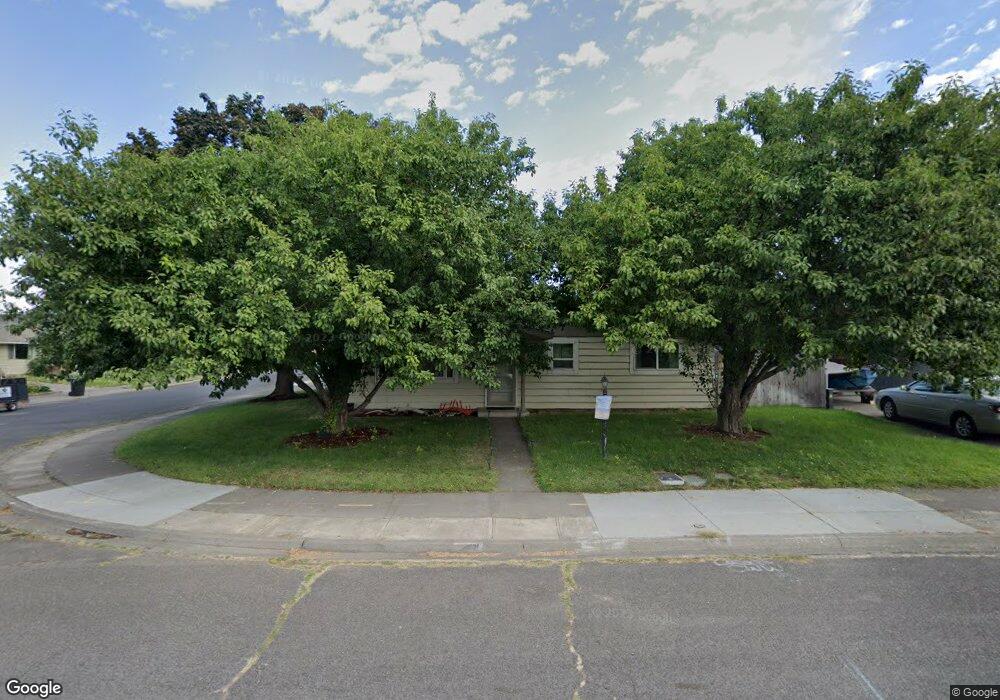
2011 Cookerly Dr Walla Walla, WA 99362
Estimated Value: $330,000 - $411,000
4
Beds
3
Baths
1,160
Sq Ft
$323/Sq Ft
Est. Value
About This Home
This home is located at 2011 Cookerly Dr, Walla Walla, WA 99362 and is currently estimated at $374,987, approximately $323 per square foot. 2011 Cookerly Dr is a home located in Walla Walla County with nearby schools including Green Park Elementary School, Pioneer Middle School, and R-Kidz Early Childhood Education Center.
Ownership History
Date
Name
Owned For
Owner Type
Purchase Details
Closed on
Jun 1, 2020
Sold by
Lammers John L and Lammers Rosalie E
Bought by
Buriani Mary and Ralls Eric
Current Estimated Value
Purchase Details
Closed on
Jun 5, 2018
Sold by
Ralls Eric J
Bought by
Ralls Eric J and Buriani Mary J
Home Financials for this Owner
Home Financials are based on the most recent Mortgage that was taken out on this home.
Original Mortgage
$175,000
Interest Rate
4.5%
Mortgage Type
New Conventional
Purchase Details
Closed on
May 1, 2008
Sold by
Britt Robert and Richmond Timothy James
Bought by
Ralls Eric
Home Financials for this Owner
Home Financials are based on the most recent Mortgage that was taken out on this home.
Original Mortgage
$191,002
Interest Rate
5.8%
Mortgage Type
FHA
Create a Home Valuation Report for This Property
The Home Valuation Report is an in-depth analysis detailing your home's value as well as a comparison with similar homes in the area
Home Values in the Area
Average Home Value in this Area
Purchase History
| Date | Buyer | Sale Price | Title Company |
|---|---|---|---|
| Buriani Mary | $157,000 | Land Ttl Of Walla Walla Cnty | |
| Ralls Eric J | -- | None Available | |
| Ralls Eric | $194,000 | Land Title Of Walla Walla Co |
Source: Public Records
Mortgage History
| Date | Status | Borrower | Loan Amount |
|---|---|---|---|
| Previous Owner | Ralls Eric J | $175,000 | |
| Previous Owner | Ralls Eric | $191,002 |
Source: Public Records
Tax History Compared to Growth
Tax History
| Year | Tax Paid | Tax Assessment Tax Assessment Total Assessment is a certain percentage of the fair market value that is determined by local assessors to be the total taxable value of land and additions on the property. | Land | Improvement |
|---|---|---|---|---|
| 2024 | $3,152 | $358,240 | $90,000 | $268,240 |
| 2023 | $3,152 | $358,240 | $90,000 | $268,240 |
| 2022 | $2,660 | $358,240 | $90,000 | $268,240 |
| 2021 | $2,636 | $247,200 | $55,000 | $192,200 |
| 2020 | $2,615 | $222,130 | $55,000 | $167,130 |
| 2019 | $2,227 | $222,130 | $55,000 | $167,130 |
| 2018 | $2,626 | $206,940 | $55,000 | $151,940 |
| 2017 | $2,273 | $199,710 | $55,000 | $144,710 |
| 2016 | $2,217 | $186,550 | $55,000 | $131,550 |
| 2015 | $2,175 | $173,100 | $55,000 | $118,100 |
| 2014 | -- | $173,100 | $55,000 | $118,100 |
| 2013 | -- | $173,100 | $55,000 | $118,100 |
Source: Public Records
Map
Nearby Homes
- 721 Wellington Ave
- 1950 K St
- 2004 Lark Dr
- 713 N Roosevelt St
- 1910 J St Unit 202
- 1910 J St Unit 201
- 597 Middle Waitsburg Rd
- 929 Olympia Dr
- 618 Cardinal Dr
- 817 Lewis St
- 1397 Caprio Loop
- 756 White St
- 934 Shasta Dr
- 1382 Caprio Loop
- 1804 Melrose St
- 1704 Walla Ave
- 1618 Walla Ave
- 1260 Jones Dr
- 1535 J St
- 2219 E Isaacs Ave Unit 16
- 2015 Cookerly Dr
- 2008 Crawford Dr
- 2012 Crawford Dr
- 2019 Cookerly Dr
- 2003 Cookerly Dr
- 907 Martin Dr
- 2005 Crawford Dr
- 2009 Crawford Dr
- 2016 Crawford Dr
- 911 Martin Dr
- 2013 Crawford Dr
- 2027 Cookerly Dr
- 2020 Crawford Dr
- 2017 Crawford Dr
- 915 Martin Dr
- 908 Martin Dr
- 2003 Glen Erin Dr
- 2021 Crawford Dr
- 912 Martin Dr
- 2031 Cookerly Dr