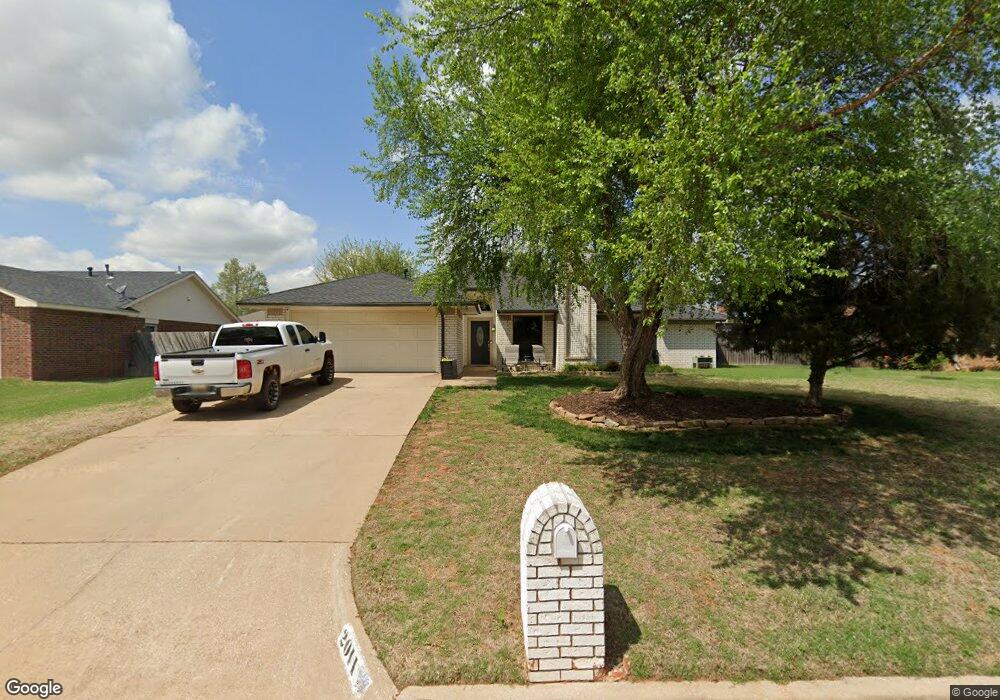
2011 Crestline Dr Duncan, OK 73533
Estimated Value: $185,116 - $204,000
3
Beds
2
Baths
1,720
Sq Ft
$114/Sq Ft
Est. Value
About This Home
This home is located at 2011 Crestline Dr, Duncan, OK 73533 and is currently estimated at $196,529, approximately $114 per square foot. 2011 Crestline Dr is a home with nearby schools including Horace Mann Elementary School, Duncan Middle School, and Duncan High School.
Ownership History
Date
Name
Owned For
Owner Type
Purchase Details
Closed on
Jan 28, 2014
Sold by
Lindsay Zachary and Lindsay Angie Marie
Bought by
Berry April
Current Estimated Value
Home Financials for this Owner
Home Financials are based on the most recent Mortgage that was taken out on this home.
Original Mortgage
$127,645
Outstanding Balance
$96,770
Interest Rate
4.5%
Mortgage Type
FHA
Estimated Equity
$99,759
Purchase Details
Closed on
Jun 6, 2007
Sold by
Williamson Bryson L
Bought by
Lindsay Zachary
Home Financials for this Owner
Home Financials are based on the most recent Mortgage that was taken out on this home.
Original Mortgage
$133,900
Interest Rate
6.16%
Mortgage Type
New Conventional
Purchase Details
Closed on
Oct 1, 2004
Sold by
Girod Daimon and Girod Tina
Purchase Details
Closed on
Nov 16, 1999
Sold by
Yarbrough Barbara A
Purchase Details
Closed on
May 8, 1995
Sold by
Muncy Michael W
Create a Home Valuation Report for This Property
The Home Valuation Report is an in-depth analysis detailing your home's value as well as a comparison with similar homes in the area
Purchase History
We collect this data history from publicly available records. To have your information removed, we recommend requesting removal directly through your county’s website.
| Date | Buyer | Sale Price | Title Company |
|---|---|---|---|
| Berry April | $130,000 | None Available | |
| Lindsay Zachary | $133,900 | Stewart Abstract & Title | |
| -- | $97,500 | -- | |
| -- | $90,000 | -- | |
| -- | $87,000 | -- |
Source: Public Records
Mortgage History
We collect this data history from publicly available records. To have your information removed, we recommend requesting removal directly through your county’s website.
| Date | Status | Borrower | Loan Amount |
|---|---|---|---|
| Open | Berry April | $127,645 | |
| Previous Owner | Lindsay Zachary | $133,900 |
Source: Public Records
Tax History
| Year | Tax Paid | Tax Assessment Tax Assessment Total Assessment is a certain percentage of the fair market value that is determined by local assessors to be the total taxable value of land and additions on the property. | Land | Improvement |
|---|---|---|---|---|
| 2025 | $1,388 | $16,461 | $1,259 | $15,202 |
| 2024 | $1,272 | $14,931 | $1,259 | $13,672 |
| 2023 | $1,272 | $14,930 | $1,259 | $13,671 |
| 2022 | $1,151 | $14,219 | $1,259 | $12,960 |
| 2021 | $1,098 | $12,897 | $1,259 | $11,638 |
| 2020 | $1,169 | $13,533 | $1,259 | $12,274 |
| 2019 | $1,115 | $12,888 | $1,259 | $11,629 |
| 2018 | $1,093 | $12,275 | $1,259 | $11,016 |
| 2017 | $1,229 | $14,301 | $1,259 | $13,042 |
| 2016 | $1,227 | $14,439 | $1,259 | $13,180 |
| 2015 | $1,292 | $14,439 | $1,259 | $13,180 |
| 2014 | $1,292 | $14,380 | $1,259 | $13,121 |
Source: Public Records
Map
Nearby Homes
- 2019 Crestmont Dr
- 2105 Crossgate Rd
- 2101 Meadowview Dr
- 2024 N Woodrock Dr
- 3990 N Ridgeview Dr
- NO ADDRESS W Plato Rd
- 1914 Windsor Dr
- 1906 Windsor Dr
- 2618 Stagestand Rd
- 2102 Stoneridge Ln
- 2345 Rockwell Dr
- 2363 Rockwell Dr
- 2310 Rockwell Dr
- 2375 Rockwell Dr
- 2117 Rockwell Dr
- 2125 Rockwell Dr
- 2113 Rockwell Dr
- 2108 Rockwell Dr
- 2129 Rockwell Dr
- 2116 Rockwell Dr
- 2007 Crestline Dr
- 2015 Crestline Dr
- 2010 Crestmont Dr
- 2014 Crestmont Dr
- 2019 Crestline Dr
- 2001 Crestline Dr
- 2006 Crestmont Dr
- 2001 2001 Crestline Dr
- 2010 Crestline Dr
- 2014 Crestline Dr
- 2006 Crestline Dr
- 2018 Crestline Dr
- 2002 Crestmont Dr
- 2018 Crestmont Dr
- 2018 Crestmont Dr
- 2018 2018 Crestline Dr
- 2002 Crestline Dr
- 2025 Crestline Dr
- 2025 2025 Crestline
- 2022 Crestline Dr
Your Personal Tour Guide
Ask me questions while you tour the home.