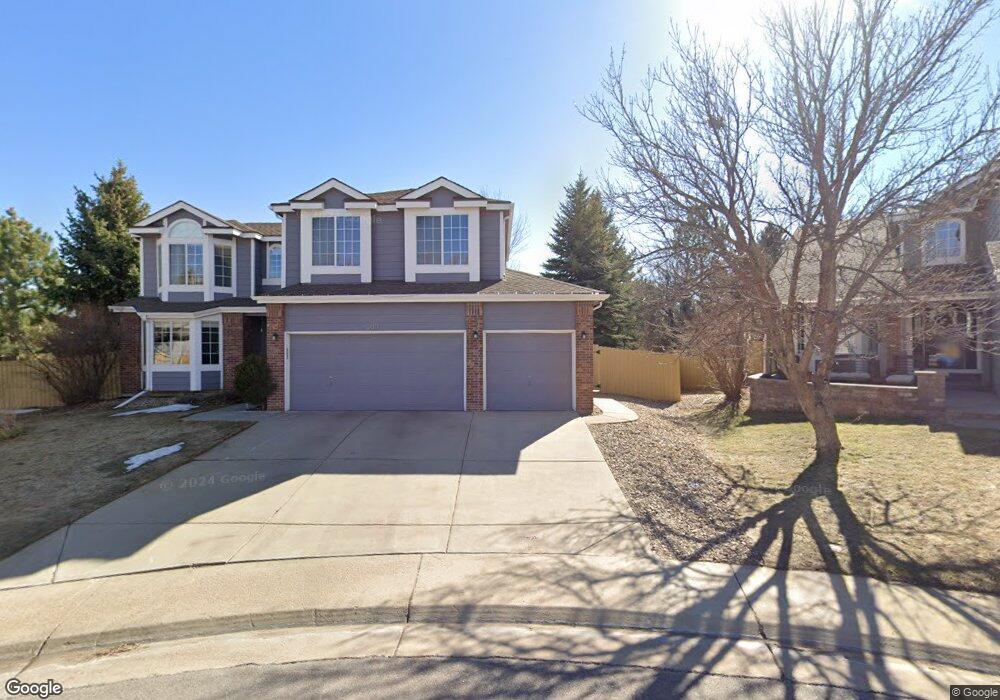
2011 Estabrook Way Superior, CO 80027
Estimated Value: $980,149 - $1,119,000
4
Beds
4
Baths
2,862
Sq Ft
$362/Sq Ft
Est. Value
About This Home
This home is located at 2011 Estabrook Way, Superior, CO 80027 and is currently estimated at $1,035,287, approximately $361 per square foot. 2011 Estabrook Way is a home located in Boulder County with nearby schools including Eldorado K-8 School, Superior Elementary School, and Monarch High School.
Ownership History
Date
Name
Owned For
Owner Type
Purchase Details
Closed on
Sep 13, 2007
Sold by
Seco Jose E and Seco Gladys M
Bought by
Pearson Wendy J
Current Estimated Value
Home Financials for this Owner
Home Financials are based on the most recent Mortgage that was taken out on this home.
Original Mortgage
$417,000
Outstanding Balance
$265,770
Interest Rate
6.7%
Mortgage Type
Purchase Money Mortgage
Estimated Equity
$769,517
Purchase Details
Closed on
Sep 30, 2004
Sold by
Dole Dennis L
Bought by
Seco Jose E and Seco Gladys M
Purchase Details
Closed on
Mar 12, 2002
Sold by
Westbrook Deann G
Bought by
Dole Dennis L
Home Financials for this Owner
Home Financials are based on the most recent Mortgage that was taken out on this home.
Original Mortgage
$282,748
Interest Rate
6.87%
Purchase Details
Closed on
May 4, 2001
Sold by
Westbrook Deann G
Bought by
Dole Dennis L
Purchase Details
Closed on
Dec 12, 1995
Sold by
Richmond Homes Inc Ii
Bought by
Dole Dennis L
Home Financials for this Owner
Home Financials are based on the most recent Mortgage that was taken out on this home.
Original Mortgage
$199,500
Interest Rate
7.4%
Create a Home Valuation Report for This Property
The Home Valuation Report is an in-depth analysis detailing your home's value as well as a comparison with similar homes in the area
Home Values in the Area
Average Home Value in this Area
Purchase History
| Date | Buyer | Sale Price | Title Company |
|---|---|---|---|
| Pearson Wendy J | $475,952 | Land Title | |
| Seco Jose E | $397,000 | -- | |
| Dole Dennis L | -- | Land Title Guarantee Company | |
| Dole Dennis L | -- | -- | |
| Dole Dennis L | $210,015 | Land Title |
Source: Public Records
Mortgage History
| Date | Status | Borrower | Loan Amount |
|---|---|---|---|
| Open | Pearson Wendy J | $417,000 | |
| Previous Owner | Dole Dennis L | $282,748 | |
| Previous Owner | Dole Dennis L | $199,500 |
Source: Public Records
Tax History Compared to Growth
Tax History
| Year | Tax Paid | Tax Assessment Tax Assessment Total Assessment is a certain percentage of the fair market value that is determined by local assessors to be the total taxable value of land and additions on the property. | Land | Improvement |
|---|---|---|---|---|
| 2025 | $6,270 | $60,094 | $27,150 | $32,944 |
| 2024 | $6,270 | $60,094 | $27,150 | $32,944 |
| 2023 | $6,184 | $60,508 | $23,999 | $40,193 |
| 2022 | $5,069 | $48,456 | $19,794 | $28,662 |
| 2021 | $5,190 | $51,394 | $20,992 | $30,402 |
| 2020 | $4,951 | $47,119 | $21,593 | $25,526 |
| 2019 | $4,882 | $47,119 | $21,593 | $25,526 |
| 2018 | $4,369 | $41,774 | $14,976 | $26,798 |
| 2017 | $4,466 | $46,184 | $16,557 | $29,627 |
| 2016 | $4,452 | $40,229 | $15,442 | $24,787 |
| 2015 | $4,231 | $37,229 | $14,806 | $22,423 |
| 2014 | $3,953 | $37,229 | $14,806 | $22,423 |
Source: Public Records
Map
Nearby Homes
- 1812 Eldorado Dr
- 2112 Grayden Ct
- 1842 Reliance Cir
- 1302 Eldorado Dr
- 1637 Reliance Cir
- 1899 Breen Ln
- 2204 Lasalle St
- 1122 Eldorado Dr
- 1815 Spaulding Cir Unit 1815
- 2169 Eagle Ave Unit 2169
- 1825 Keota Ln
- 1009 Monarch Way
- 977 Eldorado Dr
- 2321 Lakeshore Ln Unit 10
- 2323 Lakeshore Ln Unit 11
- 2643 Nicholas Way Unit 56
- 2680 Westview Way Unit 55
- 2329 Lakeshore Ln Unit 14
- 2673 Nicholas Way
- 888 Northern Way
- 1991 Estabrook Way
- 1981 Estabrook Way
- 1752 Eldorado Dr
- 1772 Eldorado Dr
- 1996 Estabrook Way
- 1792 Eldorado Dr
- 1961 Estabrook Way
- 1986 Estabrook Way
- 2081 Firestone Way
- 1976 Estabrook Way
- 1712 Eldorado Dr
- 1941 Estabrook Way
- 1822 Eldorado Dr
- 2101 Firestone Way
- 1956 Estabrook Way
- 2079 Cedaridge Cir
- 1702 Eldorado Dr
- 1931 Estabrook Way
- 1832 Eldorado Dr
- 2096 Firestone Way