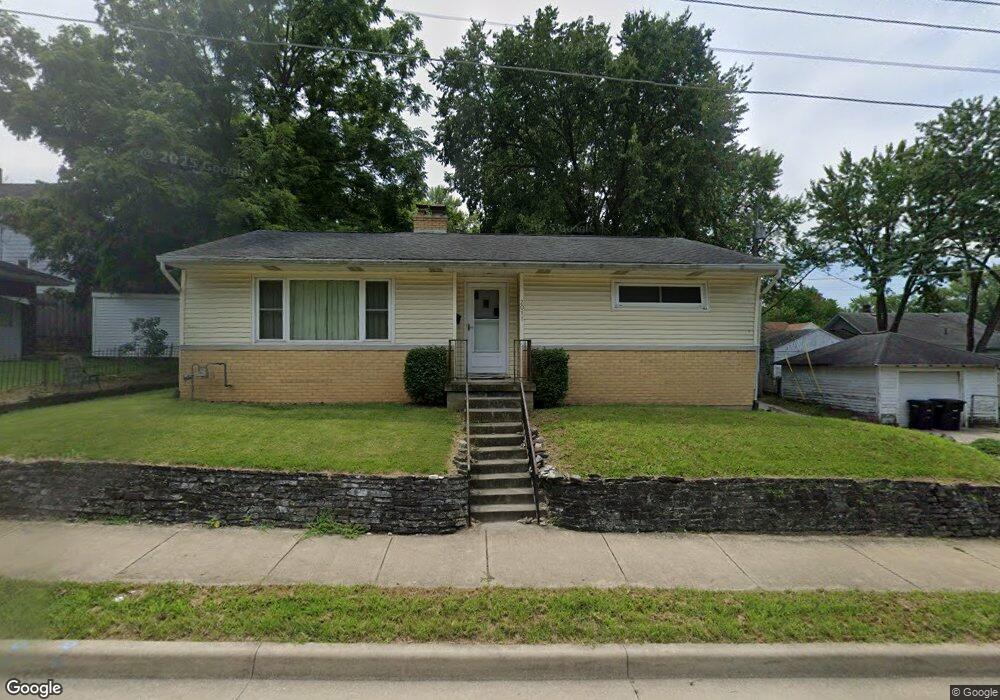
2011 Ferry St Lafayette, IN 47904
Columbian Park NeighborhoodEstimated Value: $184,000 - $214,000
3
Beds
2
Baths
1,278
Sq Ft
$154/Sq Ft
Est. Value
About This Home
This home is located at 2011 Ferry St, Lafayette, IN 47904 and is currently estimated at $197,006, approximately $154 per square foot. 2011 Ferry St is a home located in Tippecanoe County with nearby schools including Murdock Elementary School, Sunnyside Intermediate School, and Lafayette Tecumseh Junior High School.
Ownership History
Date
Name
Owned For
Owner Type
Purchase Details
Closed on
Nov 25, 2009
Sold by
Moffett Suzanne and Moffett Paul D
Bought by
Lantz Jeffrey B
Current Estimated Value
Home Financials for this Owner
Home Financials are based on the most recent Mortgage that was taken out on this home.
Original Mortgage
$70,400
Outstanding Balance
$46,037
Interest Rate
4.95%
Mortgage Type
New Conventional
Estimated Equity
$150,969
Purchase Details
Closed on
Oct 31, 2001
Sold by
Memmer John A and Memmer Pamela K
Bought by
Moffett David P
Create a Home Valuation Report for This Property
The Home Valuation Report is an in-depth analysis detailing your home's value as well as a comparison with similar homes in the area
Home Values in the Area
Average Home Value in this Area
Purchase History
| Date | Buyer | Sale Price | Title Company |
|---|---|---|---|
| Lantz Jeffrey B | -- | None Available | |
| Moffett David P | -- | -- |
Source: Public Records
Mortgage History
| Date | Status | Borrower | Loan Amount |
|---|---|---|---|
| Open | Lantz Jeffrey B | $70,400 |
Source: Public Records
Tax History Compared to Growth
Tax History
| Year | Tax Paid | Tax Assessment Tax Assessment Total Assessment is a certain percentage of the fair market value that is determined by local assessors to be the total taxable value of land and additions on the property. | Land | Improvement |
|---|---|---|---|---|
| 2024 | $1,111 | $134,200 | $9,800 | $124,400 |
| 2023 | $1,025 | $127,900 | $9,800 | $118,100 |
| 2022 | $921 | $110,500 | $9,800 | $100,700 |
| 2021 | $719 | $95,700 | $9,800 | $85,900 |
| 2020 | $558 | $86,400 | $9,800 | $76,600 |
| 2019 | $539 | $85,500 | $12,000 | $73,500 |
| 2018 | $553 | $86,300 | $12,000 | $74,300 |
| 2017 | $489 | $82,500 | $12,000 | $70,500 |
| 2016 | $456 | $81,000 | $12,000 | $69,000 |
| 2014 | $380 | $76,300 | $12,000 | $64,300 |
| 2013 | $365 | $75,600 | $12,000 | $63,600 |
Source: Public Records
Map
Nearby Homes