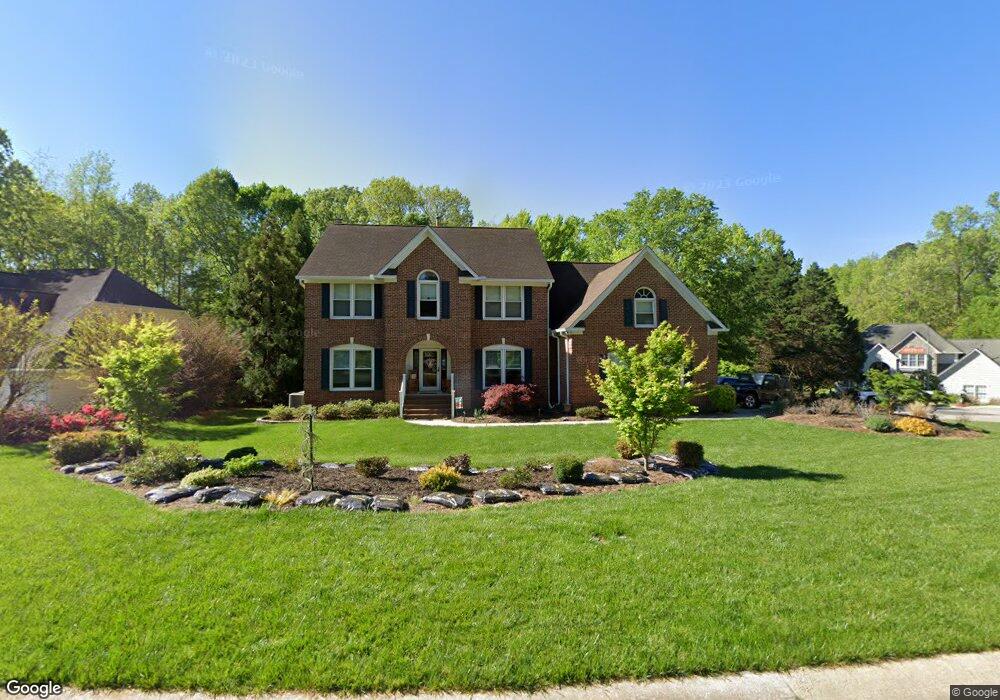
2011 Gottwald Ct Garner, NC 27529
Estimated Value: $596,626 - $648,000
4
Beds
3
Baths
3,378
Sq Ft
$187/Sq Ft
Est. Value
About This Home
This home is located at 2011 Gottwald Ct, Garner, NC 27529 and is currently estimated at $631,157, approximately $186 per square foot. 2011 Gottwald Ct is a home located in Wake County with nearby schools including Vandora Springs Elementary, North Garner Middle, and Garner High.
Ownership History
Date
Name
Owned For
Owner Type
Purchase Details
Closed on
Dec 11, 2020
Sold by
Butler David Lee and Butler Annette Corley
Bought by
Millsap David and Millsap Joni
Current Estimated Value
Home Financials for this Owner
Home Financials are based on the most recent Mortgage that was taken out on this home.
Original Mortgage
$364,720
Outstanding Balance
$325,289
Interest Rate
2.8%
Mortgage Type
New Conventional
Estimated Equity
$305,868
Purchase Details
Closed on
Dec 20, 2018
Sold by
Butler David Lee and Butler Annette Corley
Bought by
Butler David Lee and Butler Annette Corley
Purchase Details
Closed on
May 14, 2018
Sold by
Butler David Lee and Corley Annette
Bought by
Butler David Lee and Butler Annette Corley
Purchase Details
Closed on
Sep 29, 1994
Bought by
Butler David Lee and Butler Annette C
Create a Home Valuation Report for This Property
The Home Valuation Report is an in-depth analysis detailing your home's value as well as a comparison with similar homes in the area
Home Values in the Area
Average Home Value in this Area
Purchase History
| Date | Buyer | Sale Price | Title Company |
|---|---|---|---|
| Millsap David | $456,000 | None Available | |
| Butler David Lee | -- | None Available | |
| Butler David Lee | -- | None Available | |
| Butler David Lee | $240,500 | -- |
Source: Public Records
Mortgage History
| Date | Status | Borrower | Loan Amount |
|---|---|---|---|
| Open | Millsap David | $364,720 |
Source: Public Records
Tax History
| Year | Tax Paid | Tax Assessment Tax Assessment Total Assessment is a certain percentage of the fair market value that is determined by local assessors to be the total taxable value of land and additions on the property. | Land | Improvement |
|---|---|---|---|---|
| 2025 | $6,037 | $580,130 | $110,000 | $470,130 |
| 2024 | $6,016 | $580,130 | $110,000 | $470,130 |
Source: Public Records
Map
Nearby Homes
- 1302 Buffaloe Rd
- 901 Edgewater Dr
- 166 Bonica Creek Dr
- 191 Bonica Creek Dr
- 172 Bonica Creek Dr
- 1109 Stone Home Lot 3 Ln
- 1109 Stone Home Lot 2 Ln
- 0 Old Stage Rd
- 117 Gussett Dr
- 619 Benfield Ct
- 200 Coachman Dr
- 442 Waterville St
- 1301 Brucemont Dr
- 104 Gilder Woods Dr
- 102 Castill Place
- 213 Grand Pointe Dr Unit 303
- 1424 Rollman Farm Rd
- 1405 Rollman Farm Rd
- 576 Rd
- 154 Easy Wind Ln
- 2005 Gottwald Ct
- 2015 Gottwald Ct
- 2001 Gottwald Ct
- 2020 Gottwald Ct
- 2010 Gottwald Ct
- 1912 Navan Ln
- 2014 Gottwald Ct
- 2018 Gottwald Ct
- 2016 Gottwald Ct
- 1900 Navan Ln
- 1916 Navan Ln
- 1920 Navan Ln
- 1905 Navan Ln
- 2225 Cushendun Ln
- 1901 Navan Ln
- 1909 Navan Ln
- 2221 Cushendun Ln
- 2337 Dreyfus Ct
- 1913 Navan Ln
- 2341 Dreyfus Ct
Your Personal Tour Guide
Ask me questions while you tour the home.