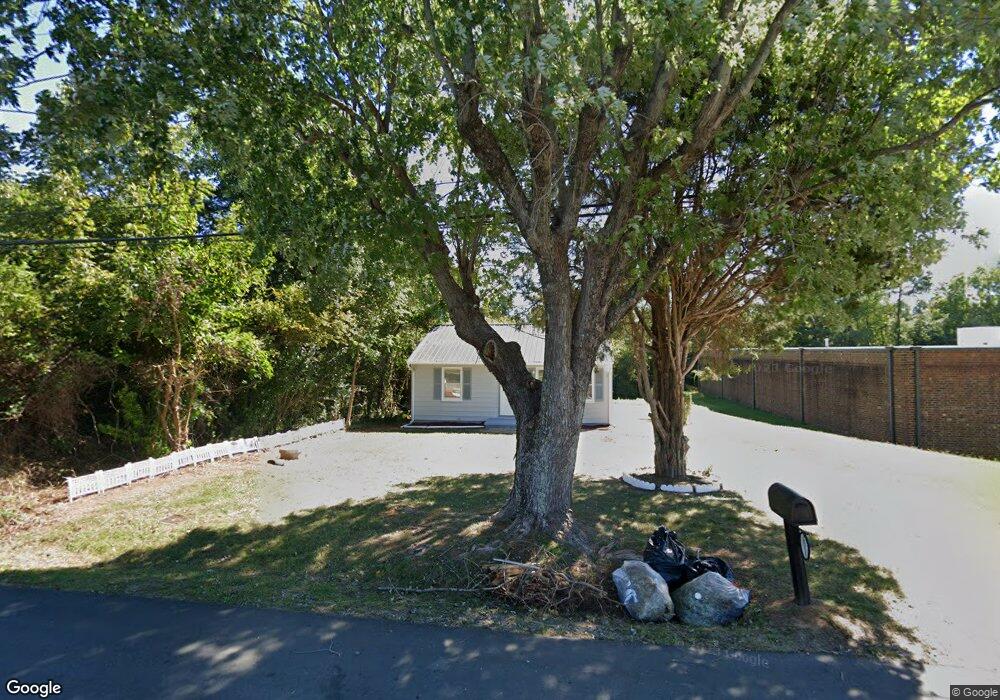
2011 Logan St High Point, NC 27263
Greater High Point NeighborhoodEstimated Value: $78,000 - $122,000
2
Beds
1
Bath
672
Sq Ft
$149/Sq Ft
Est. Value
About This Home
This home is located at 2011 Logan St, High Point, NC 27263 and is currently estimated at $100,000, approximately $148 per square foot. 2011 Logan St is a home located in Guilford County with nearby schools including Allen Jay Elementary School, Southern Guilford Middle, and Southern Guilford High School.
Ownership History
Date
Name
Owned For
Owner Type
Purchase Details
Closed on
Dec 28, 2022
Sold by
Equity Trust Company Custodian
Bought by
Lads Realestate Llc
Current Estimated Value
Home Financials for this Owner
Home Financials are based on the most recent Mortgage that was taken out on this home.
Original Mortgage
$295,200
Outstanding Balance
$285,179
Interest Rate
6.27%
Estimated Equity
-$185,179
Purchase Details
Closed on
Apr 21, 2022
Sold by
Scott Kiser
Bought by
Equity Trust and Arthur Roebuck Roth Ira
Home Financials for this Owner
Home Financials are based on the most recent Mortgage that was taken out on this home.
Original Mortgage
$52,000
Interest Rate
3.85%
Mortgage Type
New Conventional
Purchase Details
Closed on
Aug 19, 2011
Sold by
Trivette Beverly and Trivette Danny Lee
Bought by
Kiser Scott
Purchase Details
Closed on
Oct 23, 1995
Bought by
Trivette Samantha Renea
Create a Home Valuation Report for This Property
The Home Valuation Report is an in-depth analysis detailing your home's value as well as a comparison with similar homes in the area
Home Values in the Area
Average Home Value in this Area
Purchase History
| Date | Buyer | Sale Price | Title Company |
|---|---|---|---|
| Lads Realestate Llc | -- | -- | |
| Equity Trust | $40,000 | Becton Marcus | |
| Equity Trust | $40,000 | Becton Marcus | |
| Kiser Scott | $25,000 | None Available | |
| Trivette Samantha Renea | $32,500 | -- |
Source: Public Records
Mortgage History
| Date | Status | Borrower | Loan Amount |
|---|---|---|---|
| Open | Lads Realestate Llc | $295,200 | |
| Previous Owner | Equity Trust | $52,000 |
Source: Public Records
Tax History
| Year | Tax Paid | Tax Assessment Tax Assessment Total Assessment is a certain percentage of the fair market value that is determined by local assessors to be the total taxable value of land and additions on the property. | Land | Improvement |
|---|---|---|---|---|
| 2025 | $362 | $26,300 | $15,000 | $11,300 |
| 2024 | $362 | $25,200 | $15,000 | $10,200 |
| 2023 | $362 | $25,200 | $15,000 | $10,200 |
| 2022 | $355 | $26,300 | $15,000 | $11,300 |
| 2021 | $329 | $23,900 | $13,800 | $10,100 |
| 2020 | $329 | $23,900 | $13,800 | $10,100 |
| 2019 | $329 | $23,900 | $0 | $0 |
| 2018 | $328 | $23,900 | $0 | $0 |
| 2017 | $328 | $23,900 | $0 | $0 |
| 2016 | $450 | $32,100 | $0 | $0 |
| 2015 | $453 | $32,100 | $0 | $0 |
| 2014 | $460 | $32,100 | $0 | $0 |
Source: Public Records
Map
Nearby Homes
- 909 Mill Ave
- 4304 Griffins Gate Ln
- 1603 Connor Place
- 1504 Cloverdale St
- 323 Coltrane Ave
- 1213 S Elm St
- 206 E Moore Ave
- 206 Model Farm Rd
- 6147 Mendenhall Place
- 1218 Bowen Dr
- 537 Flint Ave
- 308 W Kearns Ave
- 1214 Bowen Dr
- 1217 Cloverdale St
- 2808 Uwharrie Rd
- 5441 Uwharrie Rd
- 6327 Blazing Star Dr
- 312 Model Farm Rd
- 407 W Willis Ave
- 405 W Willis Ave
Your Personal Tour Guide
Ask me questions while you tour the home.