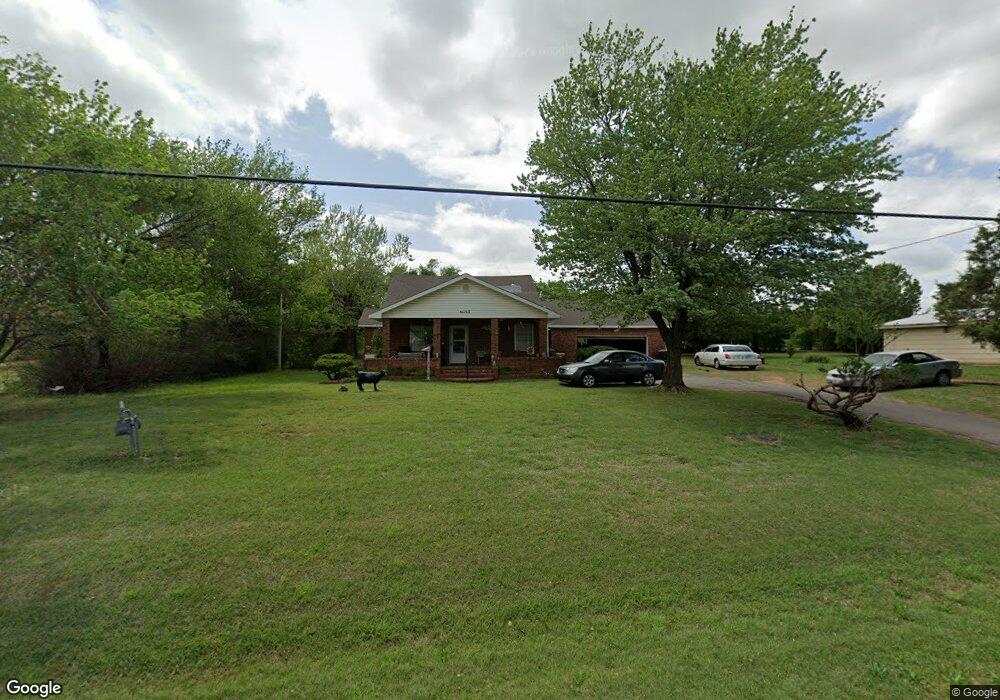
2011 N 5th St Duncan, OK 73533
Estimated Value: $94,502 - $98,000
3
Beds
2
Baths
1,023
Sq Ft
$94/Sq Ft
Est. Value
About This Home
This home is located at 2011 N 5th St, Duncan, OK 73533 and is currently estimated at $96,376, approximately $94 per square foot. 2011 N 5th St is a home located in Stephens County with nearby schools including Plato Elementary School, Duncan Middle School, and Duncan High School.
Ownership History
Date
Name
Owned For
Owner Type
Purchase Details
Closed on
Apr 28, 2023
Sold by
Pool Andrea Rachel
Bought by
Gamblin Gary D
Current Estimated Value
Purchase Details
Closed on
Jun 28, 2018
Sold by
Mckeever Gary and Mckeever Tracy
Bought by
Pool Andrea Rachel
Home Financials for this Owner
Home Financials are based on the most recent Mortgage that was taken out on this home.
Original Mortgage
$61,858
Interest Rate
5.5%
Mortgage Type
FHA
Purchase Details
Closed on
Dec 12, 2008
Sold by
Lee Jo Ann
Bought by
Mckeever Gary and Mckeever Tracy
Home Financials for this Owner
Home Financials are based on the most recent Mortgage that was taken out on this home.
Original Mortgage
$55,000
Interest Rate
6.19%
Mortgage Type
Purchase Money Mortgage
Purchase Details
Closed on
Dec 5, 1997
Sold by
Miller Dugan and Jo Ann
Purchase Details
Closed on
Nov 13, 1996
Sold by
Miller Dugan and Jo Ann
Create a Home Valuation Report for This Property
The Home Valuation Report is an in-depth analysis detailing your home's value as well as a comparison with similar homes in the area
Home Values in the Area
Average Home Value in this Area
Purchase History
| Date | Buyer | Sale Price | Title Company |
|---|---|---|---|
| Gamblin Gary D | $80,000 | None Listed On Document | |
| Gamblin Gary D | $80,000 | None Listed On Document | |
| Pool Andrea Rachel | $63,000 | Stephens Co Abstract Co | |
| Pool Andrea Rachel | $63,000 | Stephens Co Abstract Co | |
| Mckeever Gary | $55,000 | None Available | |
| Mckeever Gary | $55,000 | None Available | |
| -- | -- | -- | |
| -- | -- | -- | |
| -- | -- | -- | |
| -- | -- | -- |
Source: Public Records
Mortgage History
| Date | Status | Borrower | Loan Amount |
|---|---|---|---|
| Previous Owner | Pool Andrea Rachel | $61,858 | |
| Previous Owner | Mckeever Gary | $55,000 |
Source: Public Records
Tax History Compared to Growth
Tax History
| Year | Tax Paid | Tax Assessment Tax Assessment Total Assessment is a certain percentage of the fair market value that is determined by local assessors to be the total taxable value of land and additions on the property. | Land | Improvement |
|---|---|---|---|---|
| 2025 | $636 | $8,538 | $498 | $8,040 |
| 2024 | $684 | $9,033 | $498 | $8,535 |
| 2023 | $684 | $8,889 | $498 | $8,391 |
| 2022 | $628 | $7,760 | $498 | $7,262 |
| 2021 | $599 | $7,039 | $498 | $6,541 |
| 2020 | $602 | $6,967 | $498 | $6,469 |
| 2019 | $607 | $7,016 | $498 | $6,518 |
| 2018 | $597 | $7,512 | $498 | $7,014 |
| 2017 | $548 | $6,698 | $498 | $6,200 |
| 2016 | $516 | $6,076 | $498 | $5,578 |
| 2015 | $415 | $5,786 | $498 | $5,288 |
| 2014 | $415 | $5,619 | $578 | $5,041 |
Source: Public Records
Map
Nearby Homes
- 3495 N 5th St
- 3344 3344 N 5th
- 0 Townsend St
- 1800 N 5th St
- 2106 Carolin Dr
- 1606 Northridge Dr
- 1108 W Plato Rd Unit 29
- 1108 W Plato Rd Unit 1
- 807 Columbus Place
- 1108 1108 W Plato Unit 40
- 1108 1108 W Plato Unit 17
- 1004 Ranchwood Place
- 2110 W Club Rd
- 1014 Oakview Dr
- 2518 Wildwood Place
- 1107 W Elk Ave
- 2201 W Club Rd
- 2702 2702 Wildwood Place
- 1527 1527 N 13th
- 1312 Mccasland Pkwy