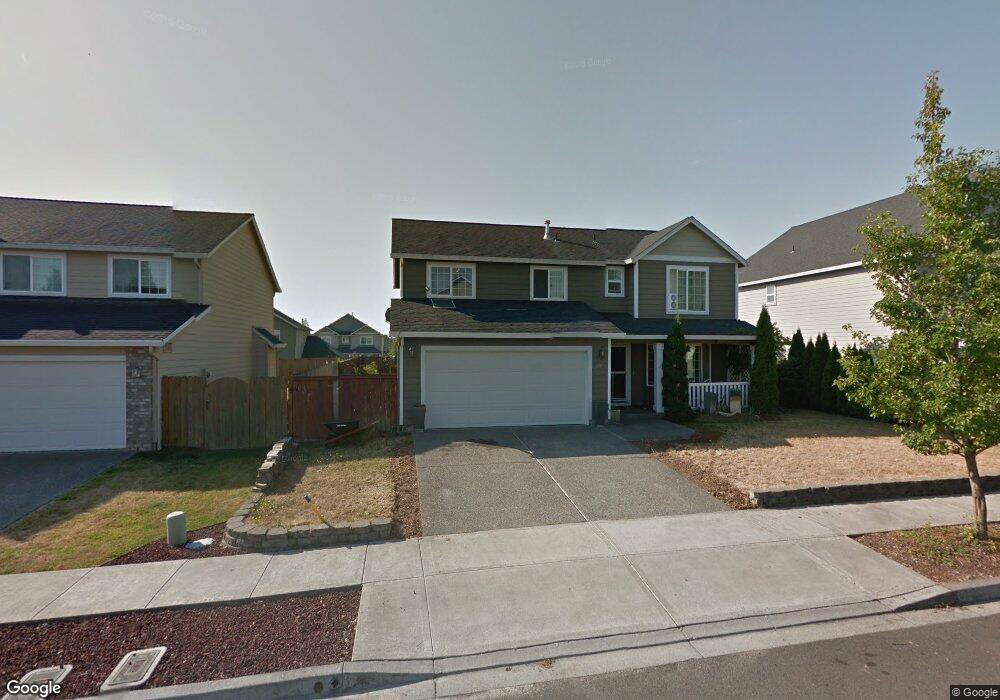
2011 N 9th Way Ridgefield, WA 98642
Estimated Value: $519,000 - $556,000
5
Beds
3
Baths
2,709
Sq Ft
$198/Sq Ft
Est. Value
About This Home
This home is located at 2011 N 9th Way, Ridgefield, WA 98642 and is currently estimated at $536,382, approximately $198 per square foot. 2011 N 9th Way is a home located in Clark County with nearby schools including Ridgefield High School.
Ownership History
Date
Name
Owned For
Owner Type
Purchase Details
Closed on
Jan 8, 2016
Sold by
Carnell Jason A and Cha Linda M
Bought by
Carnell Jason A and Cha Linda M
Current Estimated Value
Home Financials for this Owner
Home Financials are based on the most recent Mortgage that was taken out on this home.
Original Mortgage
$244,912
Outstanding Balance
$193,683
Interest Rate
3.87%
Mortgage Type
FHA
Estimated Equity
$342,699
Purchase Details
Closed on
Dec 23, 2015
Sold by
Carnell Jason A and Cha Linda M
Bought by
Carnell Jason A
Home Financials for this Owner
Home Financials are based on the most recent Mortgage that was taken out on this home.
Original Mortgage
$244,912
Outstanding Balance
$193,683
Interest Rate
3.87%
Mortgage Type
FHA
Estimated Equity
$342,699
Purchase Details
Closed on
Apr 12, 2004
Sold by
Sun Country Homes Inc
Bought by
Carnell Jason A and Carnell Melissa C
Home Financials for this Owner
Home Financials are based on the most recent Mortgage that was taken out on this home.
Original Mortgage
$137,334
Interest Rate
6.35%
Mortgage Type
Purchase Money Mortgage
Create a Home Valuation Report for This Property
The Home Valuation Report is an in-depth analysis detailing your home's value as well as a comparison with similar homes in the area
Home Values in the Area
Average Home Value in this Area
Purchase History
| Date | Buyer | Sale Price | Title Company |
|---|---|---|---|
| Carnell Jason A | -- | Clark County Title Company | |
| Carnell Jason A | -- | Clark County Title Company | |
| Carnell Jason A | $171,667 | First American Title |
Source: Public Records
Mortgage History
| Date | Status | Borrower | Loan Amount |
|---|---|---|---|
| Open | Carnell Jason A | $244,912 | |
| Closed | Carnell Jason A | $137,334 | |
| Closed | Carnell Jason A | $34,333 |
Source: Public Records
Tax History Compared to Growth
Tax History
| Year | Tax Paid | Tax Assessment Tax Assessment Total Assessment is a certain percentage of the fair market value that is determined by local assessors to be the total taxable value of land and additions on the property. | Land | Improvement |
|---|---|---|---|---|
| 2025 | $3,819 | $440,275 | $150,000 | $290,275 |
| 2024 | $3,739 | $430,817 | $150,000 | $280,817 |
| 2023 | $3,638 | $449,345 | $150,000 | $299,345 |
| 2022 | $3,359 | $418,629 | $142,290 | $276,339 |
| 2021 | $3,121 | $361,599 | $127,500 | $234,099 |
| 2020 | $3,211 | $314,270 | $105,000 | $209,270 |
| 2019 | $2,850 | $318,958 | $109,538 | $209,420 |
| 2018 | $3,042 | $286,016 | $0 | $0 |
| 2017 | $2,346 | $263,570 | $0 | $0 |
| 2016 | $2,283 | $240,112 | $0 | $0 |
| 2015 | $2,192 | $223,938 | $0 | $0 |
| 2014 | -- | $205,749 | $0 | $0 |
| 2013 | -- | $187,580 | $0 | $0 |
Source: Public Records
Map
Nearby Homes
- 1831 N 8th Way
- 0 NW 280th St
- 2313 N Heron Dr
- 4115 N 15th Ct
- 4219 N 15th Ct
- 4200 N 15th Ct
- 4304 N 15th Ct
- 4211 N 15th Ct
- 2410 N Heron Dr
- 2116 N 3rd Way
- 1200 N Heron Dr
- 000 NW 51st Ave
- 1116 N Heron Dr
- 4211 N 15th Way
- 4219 N 15th Way
- 2900 N Pioneer Canyon Dr
- 2805 N 2nd Way
- 14 S Gee Creek Loop
- 3524 N 12th Cir
- 252 N 30th Dr