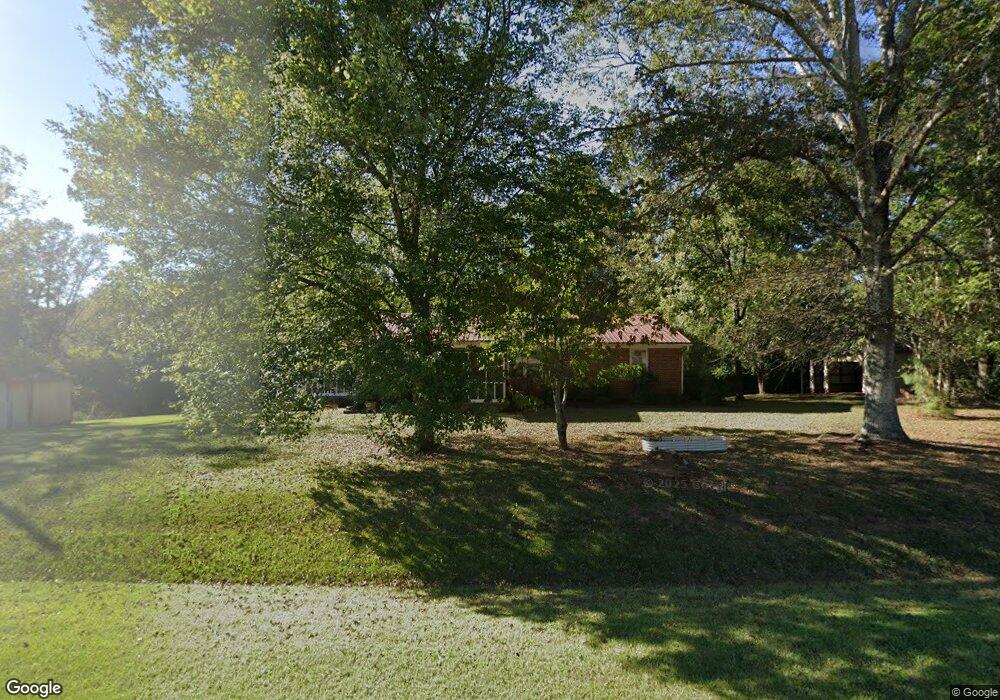
2011 S Highway 100 Bowdon, GA 30108
Estimated Value: $186,000 - $262,000
3
Beds
1
Bath
1,350
Sq Ft
$159/Sq Ft
Est. Value
About This Home
This home is located at 2011 S Highway 100, Bowdon, GA 30108 and is currently estimated at $215,310, approximately $159 per square foot. 2011 S Highway 100 is a home located in Carroll County with nearby schools including Bowdon Elementary School, Bowdon Middle School, and Bowdon High School.
Ownership History
Date
Name
Owned For
Owner Type
Purchase Details
Closed on
Jul 30, 2021
Sold by
Brown Jeffrey C
Bought by
Butler Janice Webb
Current Estimated Value
Home Financials for this Owner
Home Financials are based on the most recent Mortgage that was taken out on this home.
Original Mortgage
$142,373
Outstanding Balance
$129,461
Interest Rate
2.9%
Mortgage Type
FHA
Estimated Equity
$85,849
Purchase Details
Closed on
Dec 17, 2018
Sold by
Cosper Shelbia Jean
Bought by
Brown Jeffrey C and Brown Jeliegha M
Home Financials for this Owner
Home Financials are based on the most recent Mortgage that was taken out on this home.
Original Mortgage
$78,787
Interest Rate
4.9%
Mortgage Type
New Conventional
Purchase Details
Closed on
Mar 13, 2013
Sold by
Lanier Daisy
Bought by
Cosper Shelbia Jean
Purchase Details
Closed on
May 5, 2000
Sold by
Lanier
Bought by
Lanier Daisy
Purchase Details
Closed on
Jul 18, 1962
Bought by
Lanier
Create a Home Valuation Report for This Property
The Home Valuation Report is an in-depth analysis detailing your home's value as well as a comparison with similar homes in the area
Home Values in the Area
Average Home Value in this Area
Purchase History
| Date | Buyer | Sale Price | Title Company |
|---|---|---|---|
| Butler Janice Webb | $145,000 | -- | |
| Brown Jeffrey C | $78,000 | -- | |
| Cosper Shelbia Jean | -- | -- | |
| Lanier Daisy | -- | -- | |
| Lanier | -- | -- |
Source: Public Records
Mortgage History
| Date | Status | Borrower | Loan Amount |
|---|---|---|---|
| Open | Butler Janice Webb | $142,373 | |
| Previous Owner | Brown Jeffrey C | $78,787 |
Source: Public Records
Tax History Compared to Growth
Tax History
| Year | Tax Paid | Tax Assessment Tax Assessment Total Assessment is a certain percentage of the fair market value that is determined by local assessors to be the total taxable value of land and additions on the property. | Land | Improvement |
|---|---|---|---|---|
| 2024 | $1,700 | $79,154 | $6,631 | $72,523 |
| 2023 | $1,700 | $71,259 | $5,305 | $65,954 |
| 2022 | $1,224 | $48,792 | $3,537 | $45,255 |
| 2021 | $942 | $42,711 | $4,325 | $38,386 |
| 2020 | $869 | $38,601 | $3,932 | $34,669 |
| 2019 | $704 | $36,052 | $3,932 | $32,120 |
| 2018 | $854 | $32,534 | $3,932 | $28,602 |
| 2017 | $857 | $32,534 | $3,932 | $28,602 |
| 2016 | $865 | $32,834 | $3,932 | $28,902 |
| 2015 | $115 | $21,625 | $5,683 | $15,943 |
| 2014 | $116 | $21,626 | $5,683 | $15,943 |
Source: Public Records
Map
Nearby Homes
- 1794 Georgia 100
- 1770 Georgia 100
- 746 Dot Rd
- 101 Winding Rd Unit LOT 6
- 101 Winding Rd Unit LOT 5
- 101 Winding Rd Unit LOT 1A & 1B & LOT 2
- 1195 Watts Rd
- 992 Reavesville Rd
- 5 Winding Rd
- 6 Winding Rd
- 0 New Mexico Rd Unit TRACT 1 (7.47 ACRES)
- 0 New Mexico Road (Tract 1-- 7 47 Acres) Unit 234
- 215 Wessmanor Dr
- 30 Alyssa Ln
- 721 Wedowee St
- 621 Rance Foster Rd
- 717 Wedowee St
- 674 Wedowee St
- 101 Winding Road - Lot 1a & 1b & Lot 2
- 75 Dashboard Rd
- 0 S Highway 100
- 0 S Highway 100 Unit 8512633
- 0 S Highway 100 Unit 7153855
- 0 S Highway 100 Unit 9018625
- 0 S Highway 100 Unit 8293222
- 0 S Highway 100 Unit 8138447
- 0 S Highway 100 Unit 8384783
- 0 S Highway 100 Unit 8402048
- 1996 S 100 Hwy
- 1996 S Highway 100
- 1983 S Highway 100
- 1988 Georgia 100
- 1988 S Highway 100
- 1988 S Highway 100
- 1976 Georgia 100
- 2049 S Highway 100
- 1976 S Highway 100
- 2024 S Highway 100
- 2060 S Highway 100
- 1968 S Highway 100