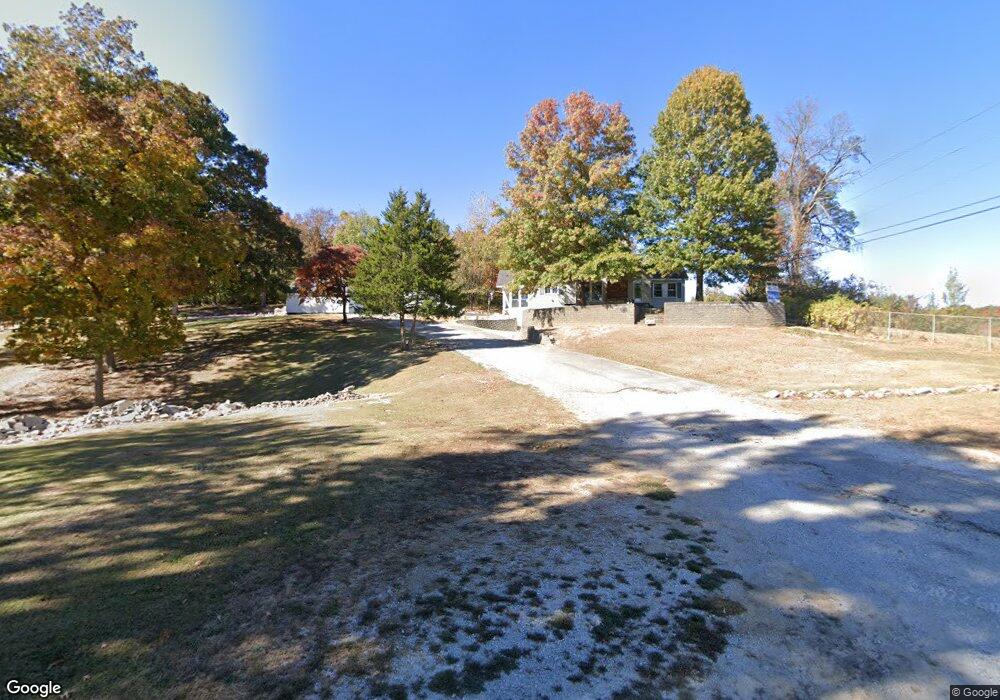
2011 S Old Highway 141 Fenton, MO 63026
Estimated Value: $206,000 - $336,000
--
Bed
--
Bath
1,126
Sq Ft
$238/Sq Ft
Est. Value
About This Home
This home is located at 2011 S Old Highway 141, Fenton, MO 63026 and is currently estimated at $268,000, approximately $238 per square foot. 2011 S Old Highway 141 is a home with nearby schools including Meramec Heights Elementary School, Ridgewood Middle School, and Fox Senior High School.
Ownership History
Date
Name
Owned For
Owner Type
Purchase Details
Closed on
Sep 15, 2021
Sold by
Trokey Kenneth R and Trokey Patricia V
Bought by
Mills Thomas D and Mills Donna S
Current Estimated Value
Purchase Details
Closed on
May 3, 2016
Sold by
Willey Naomi R
Bought by
Willey Willey Naomi R Naomi R and James L & Naomi R Willey Living Trust
Purchase Details
Closed on
Aug 16, 2002
Sold by
Neopolitan Michael and Neopolitan Justine
Bought by
Bush Scott A and Bush Stacey A
Purchase Details
Closed on
Aug 9, 2002
Sold by
Bush Scott A and Bush Stacey A
Bought by
Bush Scott A and Bush Stacey A
Purchase Details
Closed on
Mar 23, 1999
Sold by
Neopolitan Michael and Neopolitan Scott A
Bought by
Bush Scott A
Home Financials for this Owner
Home Financials are based on the most recent Mortgage that was taken out on this home.
Original Mortgage
$105,693
Interest Rate
6.89%
Create a Home Valuation Report for This Property
The Home Valuation Report is an in-depth analysis detailing your home's value as well as a comparison with similar homes in the area
Home Values in the Area
Average Home Value in this Area
Purchase History
| Date | Buyer | Sale Price | Title Company |
|---|---|---|---|
| Mills Thomas D | $30,000 | None Available | |
| Willey Willey Naomi R Naomi R | -- | None Available | |
| Bush Scott A | -- | Commonwealth Title | |
| Bush Scott A | -- | Commonwealth Title | |
| Bush Scott A | -- | -- |
Source: Public Records
Mortgage History
| Date | Status | Borrower | Loan Amount |
|---|---|---|---|
| Previous Owner | Bush Scott A | $105,693 | |
| Closed | Bush Scott A | $1,200 |
Source: Public Records
Tax History Compared to Growth
Tax History
| Year | Tax Paid | Tax Assessment Tax Assessment Total Assessment is a certain percentage of the fair market value that is determined by local assessors to be the total taxable value of land and additions on the property. | Land | Improvement |
|---|---|---|---|---|
| 2025 | $1,443 | $21,300 | $2,700 | $18,600 |
| 2024 | $1,443 | $19,700 | $2,700 | $17,000 |
| 2023 | $1,443 | $19,700 | $2,700 | $17,000 |
| 2022 | $1,446 | $19,700 | $2,700 | $17,000 |
| 2021 | $1,445 | $19,700 | $2,700 | $17,000 |
| 2020 | $1,402 | $18,000 | $2,300 | $15,700 |
| 2019 | $1,404 | $18,000 | $2,300 | $15,700 |
| 2018 | $1,400 | $18,000 | $2,300 | $15,700 |
| 2017 | $1,357 | $18,000 | $2,300 | $15,700 |
| 2016 | $1,299 | $17,300 | $3,100 | $14,200 |
| 2015 | $1,256 | $17,300 | $3,100 | $14,200 |
| 2013 | -- | $17,100 | $3,100 | $14,000 |
Source: Public Records
Map
Nearby Homes
- 223 Cool Valley Dr
- 5034 Corisande Woods Dr
- 615 Corisande Hill Rd
- 802 Fox Creek Dr
- 2526 Whitewater Ct
- 1589 Sparrow Point Ln
- 990 Hydeaway Ct
- 2 Autumn Bluffs Ct
- 711 Turnbridge Dr
- 140 Fenton Crossing
- 601 Northview Dr
- 1017 Top Dr
- 1102 Silverwillow Ct
- 150 Winter Park Ct
- 15 Waybridge Ct
- 2323 Konert Rd
- 317 Winding Bluffs Ct
- 388 Winding Bluffs Ct
- 373 Winding Bluffs Ct
- 136 Winter Valley Dr
- 1 Eastview Dr
- 3 Eastview Dr
- 5 Eastview Dr
- 5 Cedar Ln
- 1 Heritage Ct
- 2 Eastview Dr
- 4 Eastview Dr
- 3 Cedar Ln
- 411 Sunset View Dr Unit B
- 411 Sunset View Dr
- 200 Sunset View Dr
- 117 Eastview Dr
- 2113 S Old Highway 141
- 407 Sunset View Dr
- 5 Pleasant Ln
- 112 Clearwater Dr
- 6 Eastview Dr
- 110 Clearwater Dr
- 2119 S Old Highway 141
- 403 Sunset View Dr